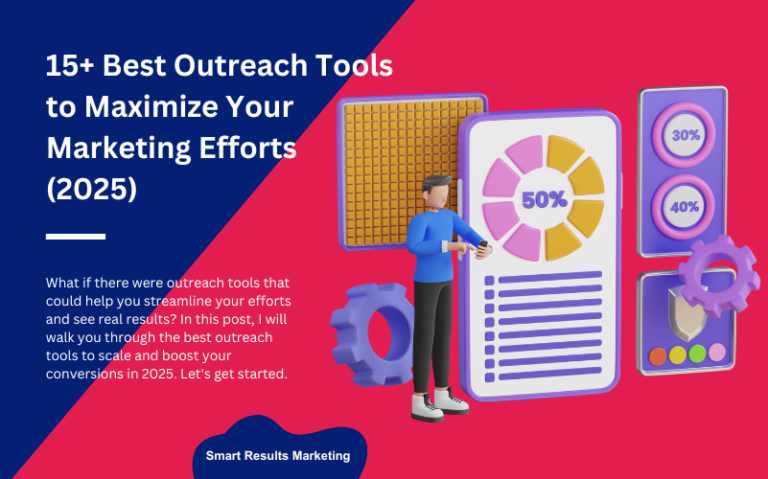
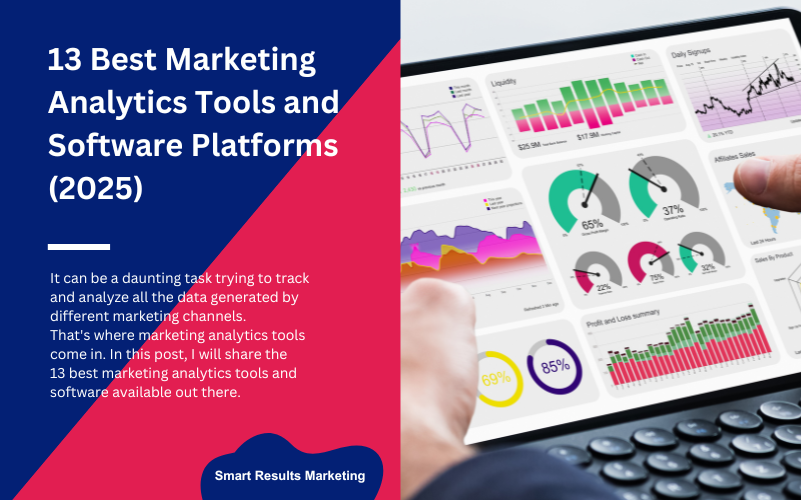
13 Best Marketing Analytics Tools and Software Platforms (2025)
Do you ever find yourself buried under a mountain of marketing data, unsure of how to make sense of it all?
As a marketer, I can definitely relate.
It can be a daunting task trying to track and analyze all the data generated by different marketing channels.
That’s where marketing analytics tools come in.
In this post, I will share the 13 best marketing analytics tools and software available in 2024.
I’ve tested them, so I know firsthand how they can help you make sense of your marketing data and optimize your campaigns for maximum impact.
So, let’s dive right into it!
What are the marketing analysis tools?
Marketing analytics tools are like your superhero squad for tracking and analyzing your marketing channels.
They can help you gain insights and optimize your campaigns with tools like social media analytics, email marketing software, and SEO tracking.
Picking the right marketing analytics tools is key to making data-driven decisions and reaching your goals.
1. Hotjar
So let’s suit up and explore the best marketing analytics tools that will help you conquer the marketing world in 2024.
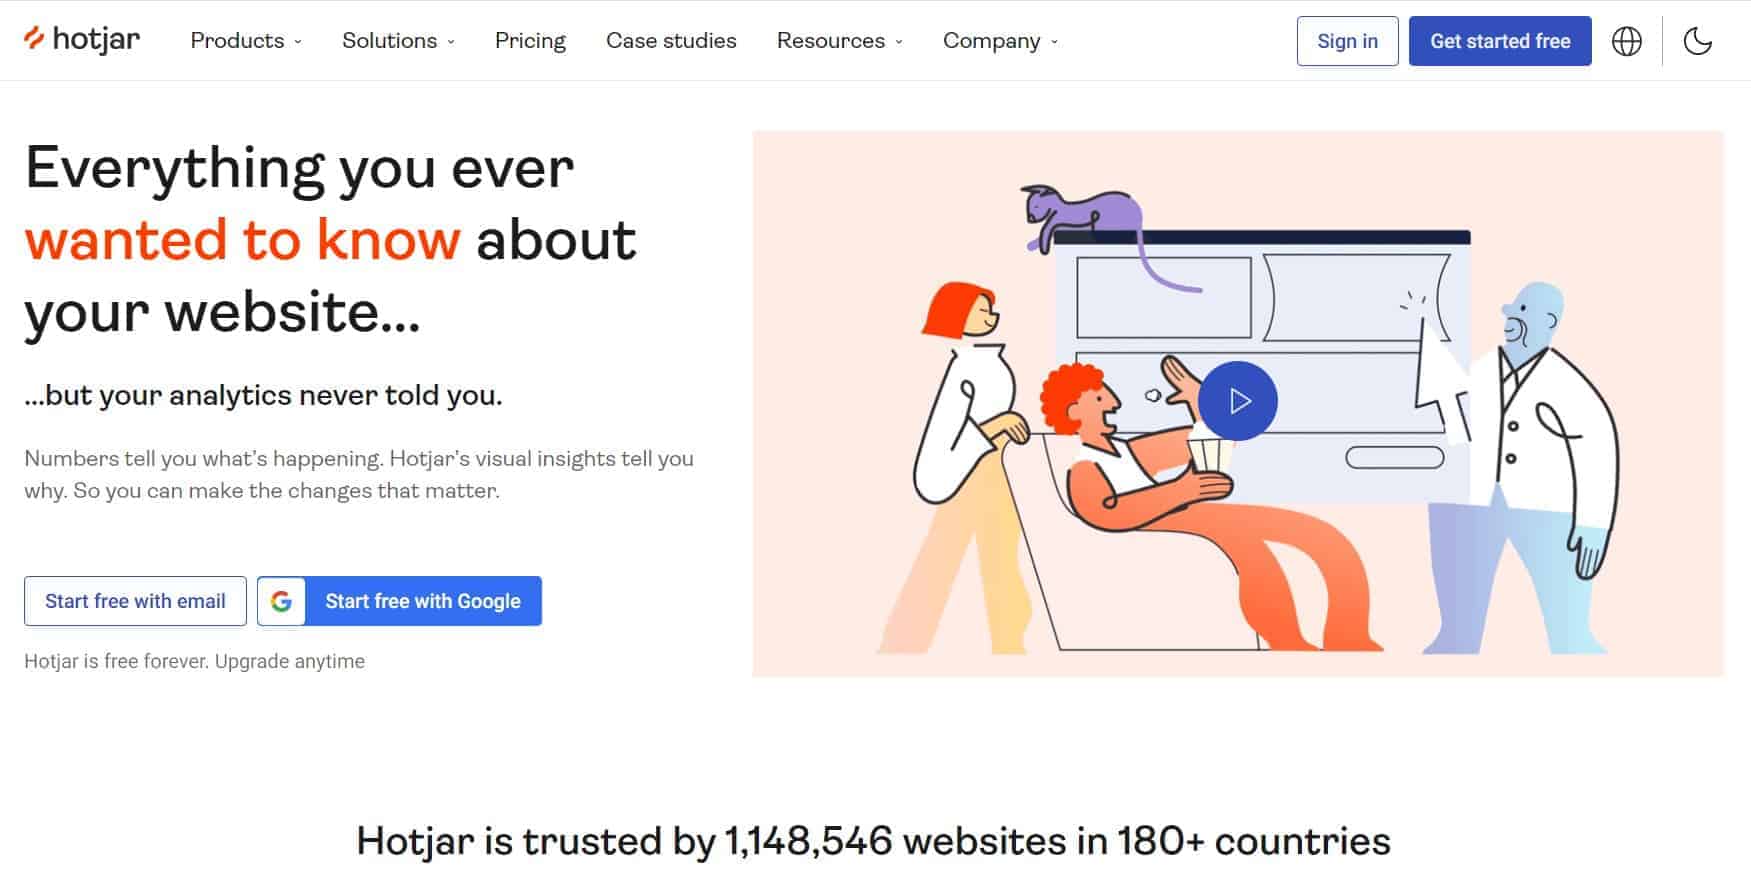
Hotjar is a tool that helps you understand how users interact with your website or mobile app. It provides analytics and feedback to give you valuable insights into user behaviour.
It is a widely used tool by marketers, web designers, product managers, and UX researchers to gain insight into the way their customers engage with their digital platforms.
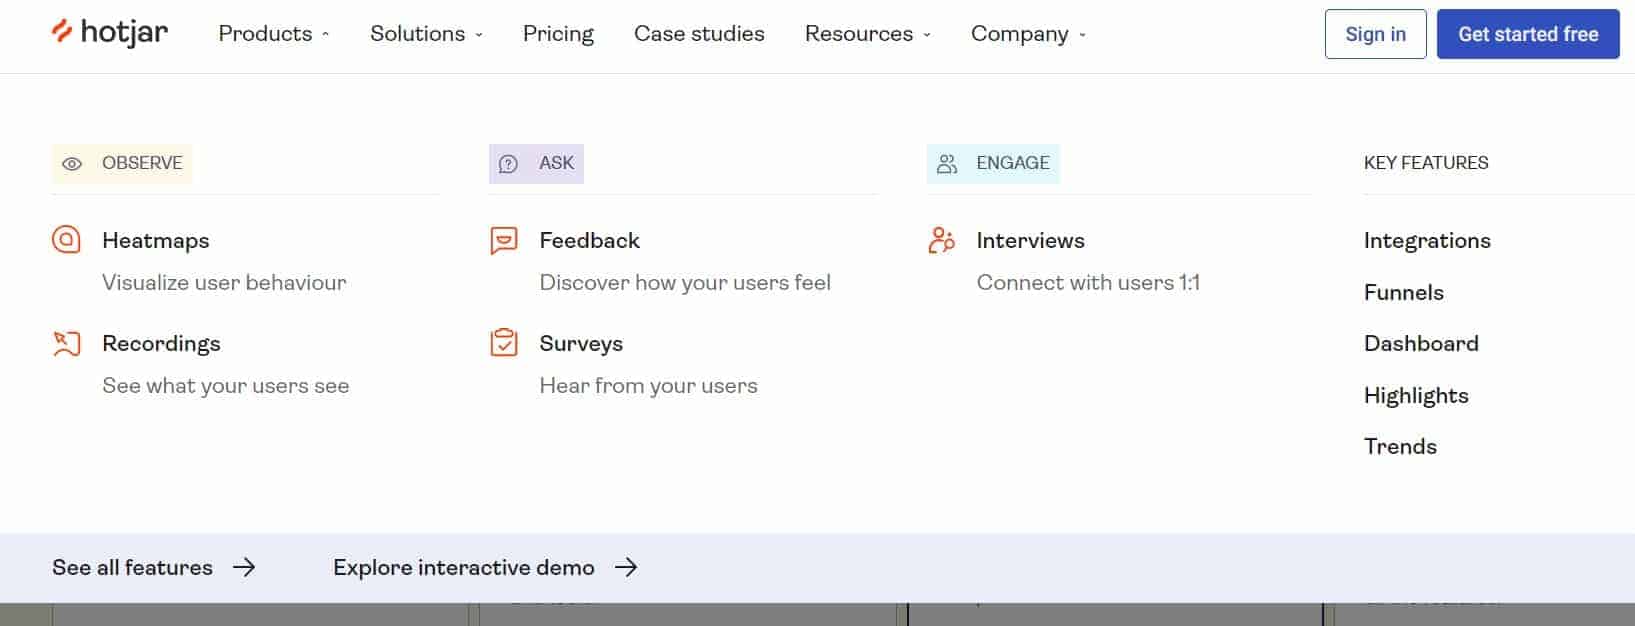
Key features:
- Heatmapping: One of the standout features of Hotjar is its ability to create heatmaps of your website, showing you exactly where visitors are clicking and where they’re not.
- Session recording: Another useful feature is the ability to record user sessions on your site.
- This is a great way to see how users navigate your site and where they might be getting stuck or experiencing issues.
- Feedback tool: Hotjar also includes a feedback tool that allows you to collect feedback directly from users on your site.
- This is a great way to hear directly from your audience and gather valuable insights for improvement.
What I like (pros):
- Comprehensive suite of features: Hotjar offers a wide range of features that cover many aspects of user behavior analysis, making it a valuable all-in-one tool.
- Heatmapping feature: The heatmapping feature is very helpful because it shows me which parts of my website are doing well and which ones need improvement.
- Session recording: The ability to record user sessions is also incredibly helpful, as it provides me with a more detailed understanding of how users are navigating my site.
- Feedback tool: I also appreciate the feedback tool, as it allows me to gather insights directly from users and make improvements based on their feedback.
Pricing:
Hotjar offers a range of pricing plans, starting at €32 per month for the basic plan and going up to €80 monthly for the business plan.
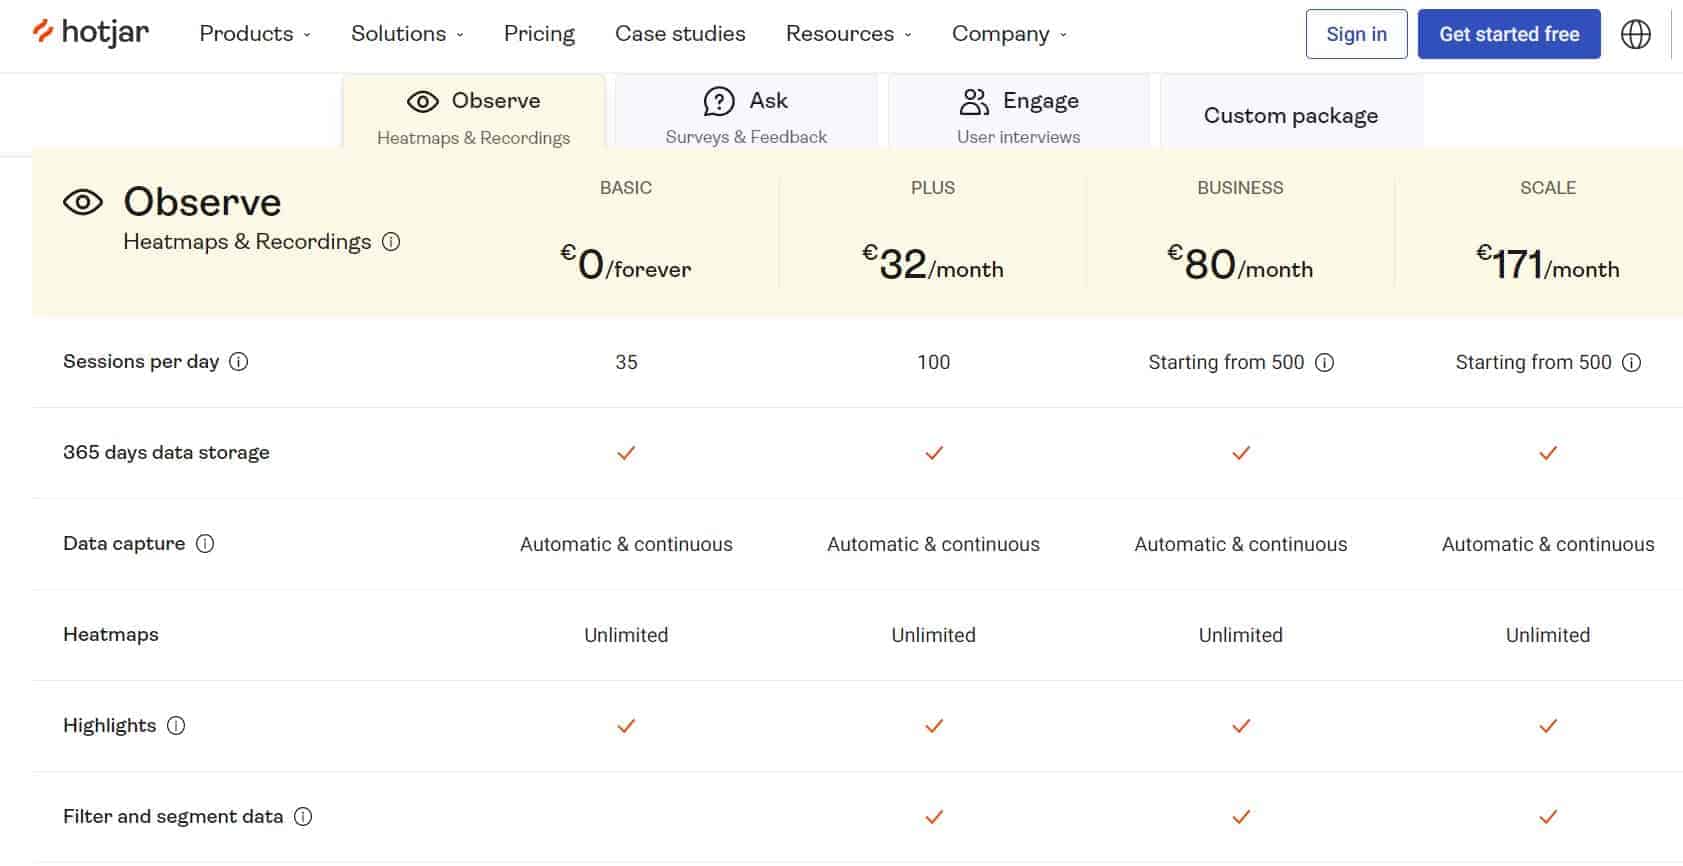
It’s important to choose the plan that fits your needs and budget because the pricing is based on the number of pageviews you want to track.
Overall, I find the pricing fair and reasonable for the value that Hotjar provides.
2.Funnel.io
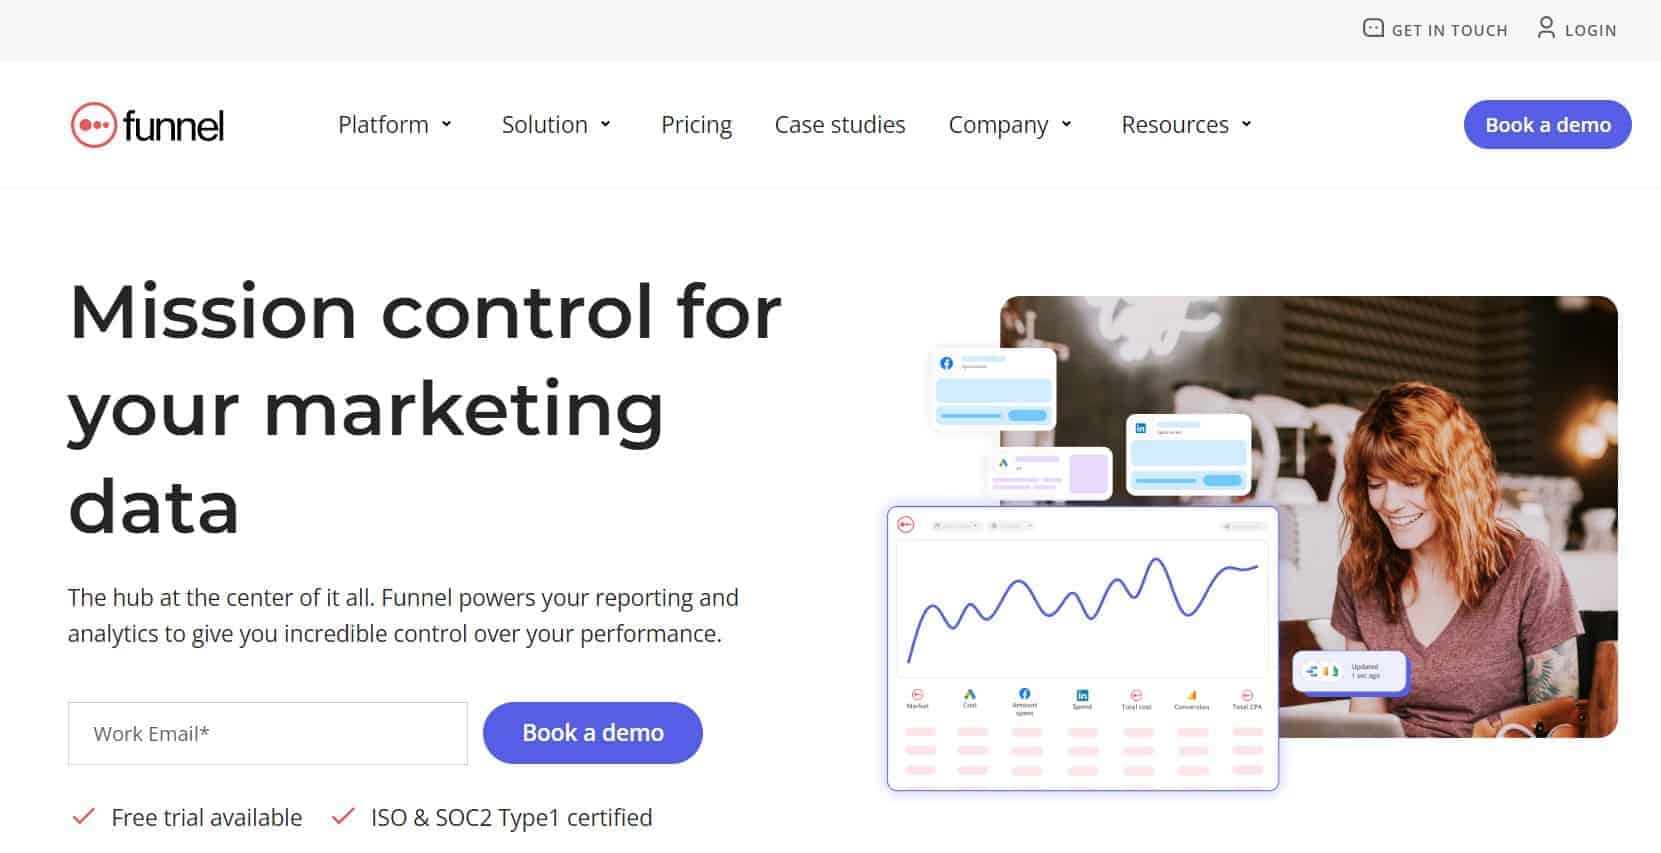
Funnel.io is a tool for marketing analytics that consolidates data from various sources into one platform.
It automates the process of data collection, mapping and transformation, and reporting, making it easy for businesses to use.
The tool simplifies the data aggregation process and gives marketers a holistic view of their marketing performance, helping them make data-driven decisions.
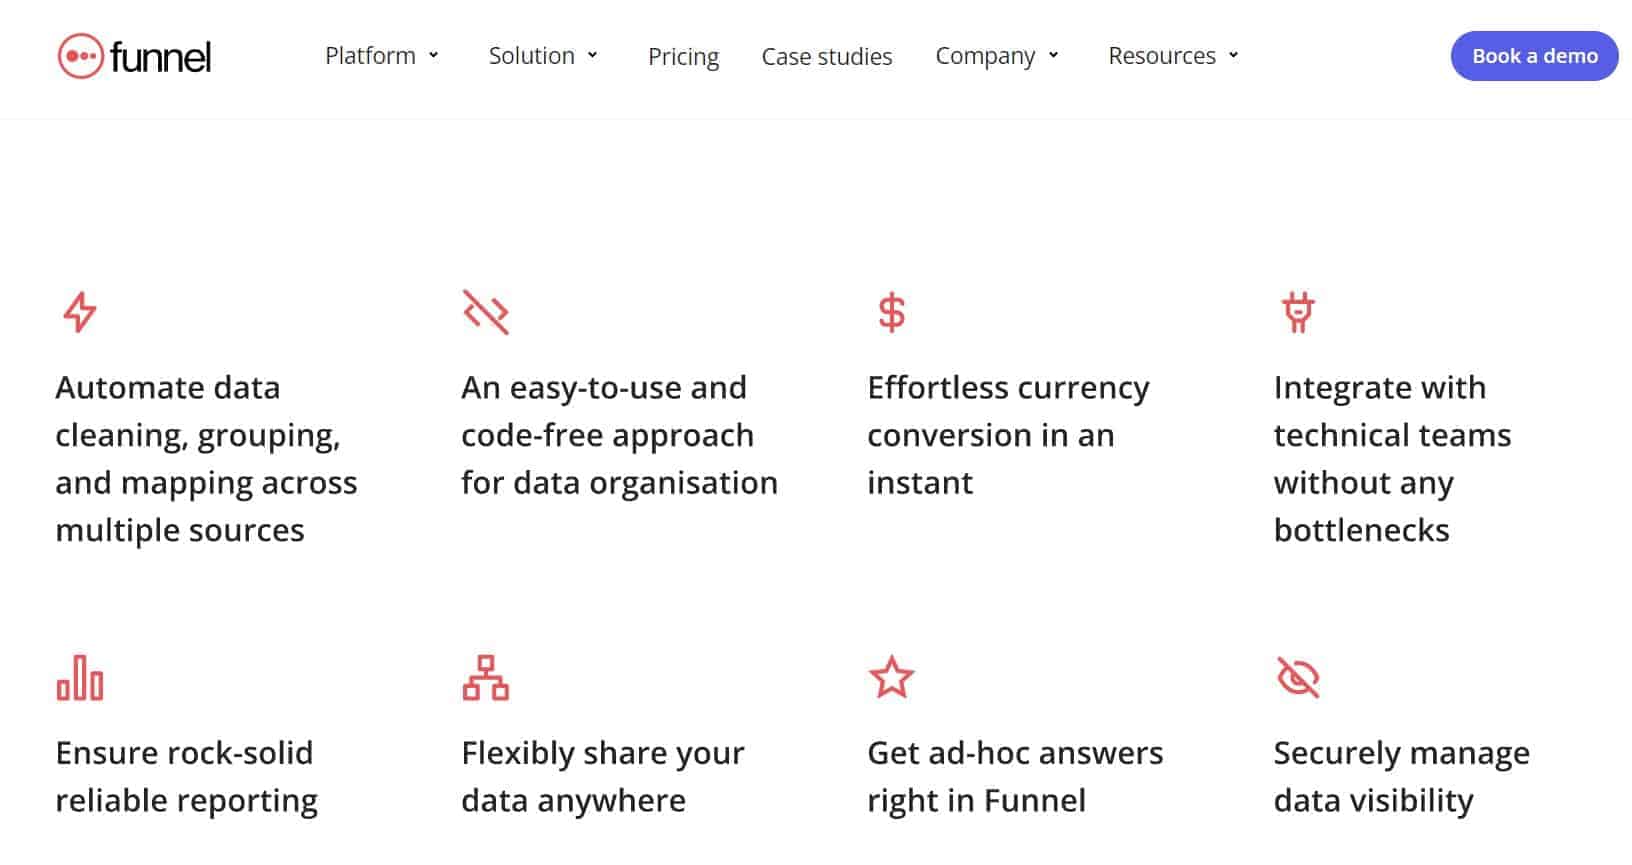
Key Features:
Data aggregation: It enables marketers to collect data from over 500 marketing sources, including Google Ads, Facebook Ads, Instagram Ads, Bing Ads, and more.
Automated data mapping: It can automatically map and transform data from different sources into one coherent dataset, saving marketers time and effort.
Customizable reporting: With Funnel.io, marketers can easily create custom reports and dashboards, allowing them to visualize their data and share insights with other stakeholders.
Data visualization: It provides users with interactive data visualization tools such as charts and graphs, which help marketers to identify trends and patterns.
Cost data analysis: It enables users to analyze their cost data and calculate ROI across multiple channels.
What I Like:
Easy to use: It is incredibly easy to use, even for those who are not tech-savvy.
Saves time: The tool automates the data collection, mapping, and transformation process, allowing marketers to focus on analyzing their data and making informed decisions.
Flexible pricing: It offers flexible pricing plans, making it accessible to businesses of all sizes.
Great customer support: The customer support team is very responsive and helpful.
How to Use Funnel.io:
Using Funnel.io is relatively straightforward.
Simply sign up for an account, connect your marketing channels, and let the tool do the rest.
Once you’ve connected your channels, you can customize your reports and dashboards, visualize your data, and share your insights with other stakeholders.
Pricing:
Funnel.io has a variety of pricing plans available. The “Esential” plan starts at £320 per month, while the “Plus” plan can be purchased for £900 per month.
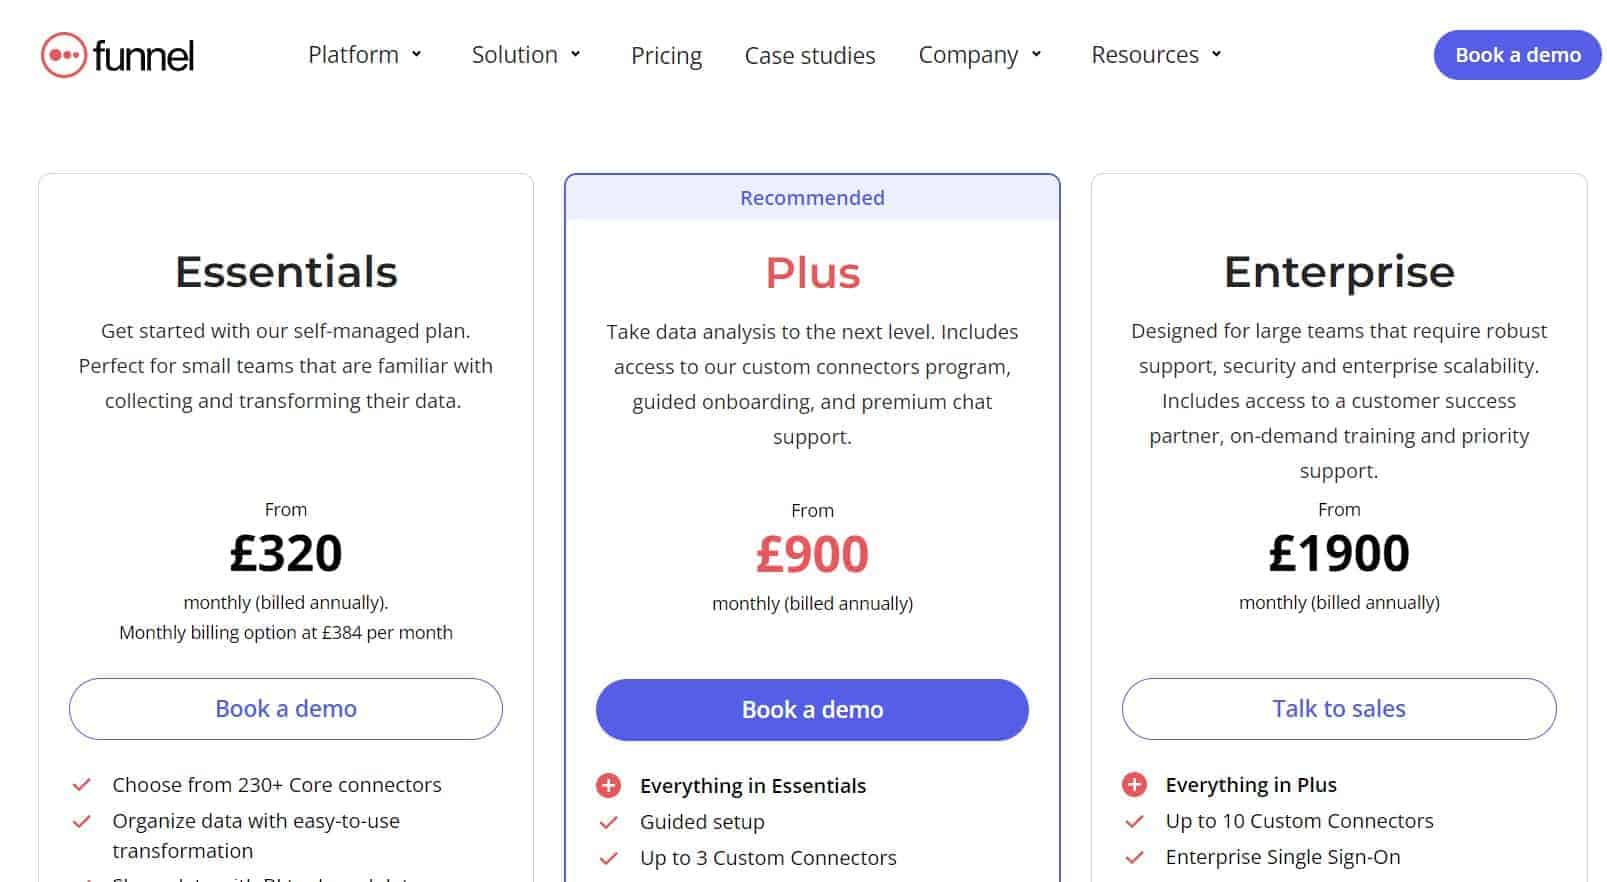
Custom pricing is also available for enterprise customers.
Bottom Line:
The tool gives users valuable insights into their marketing performance, enabling them to make data-driven decisions.
While there is a learning curve involved, Funnel.io is user-friendly, flexible, and comes with excellent customer support.
3. Adverity
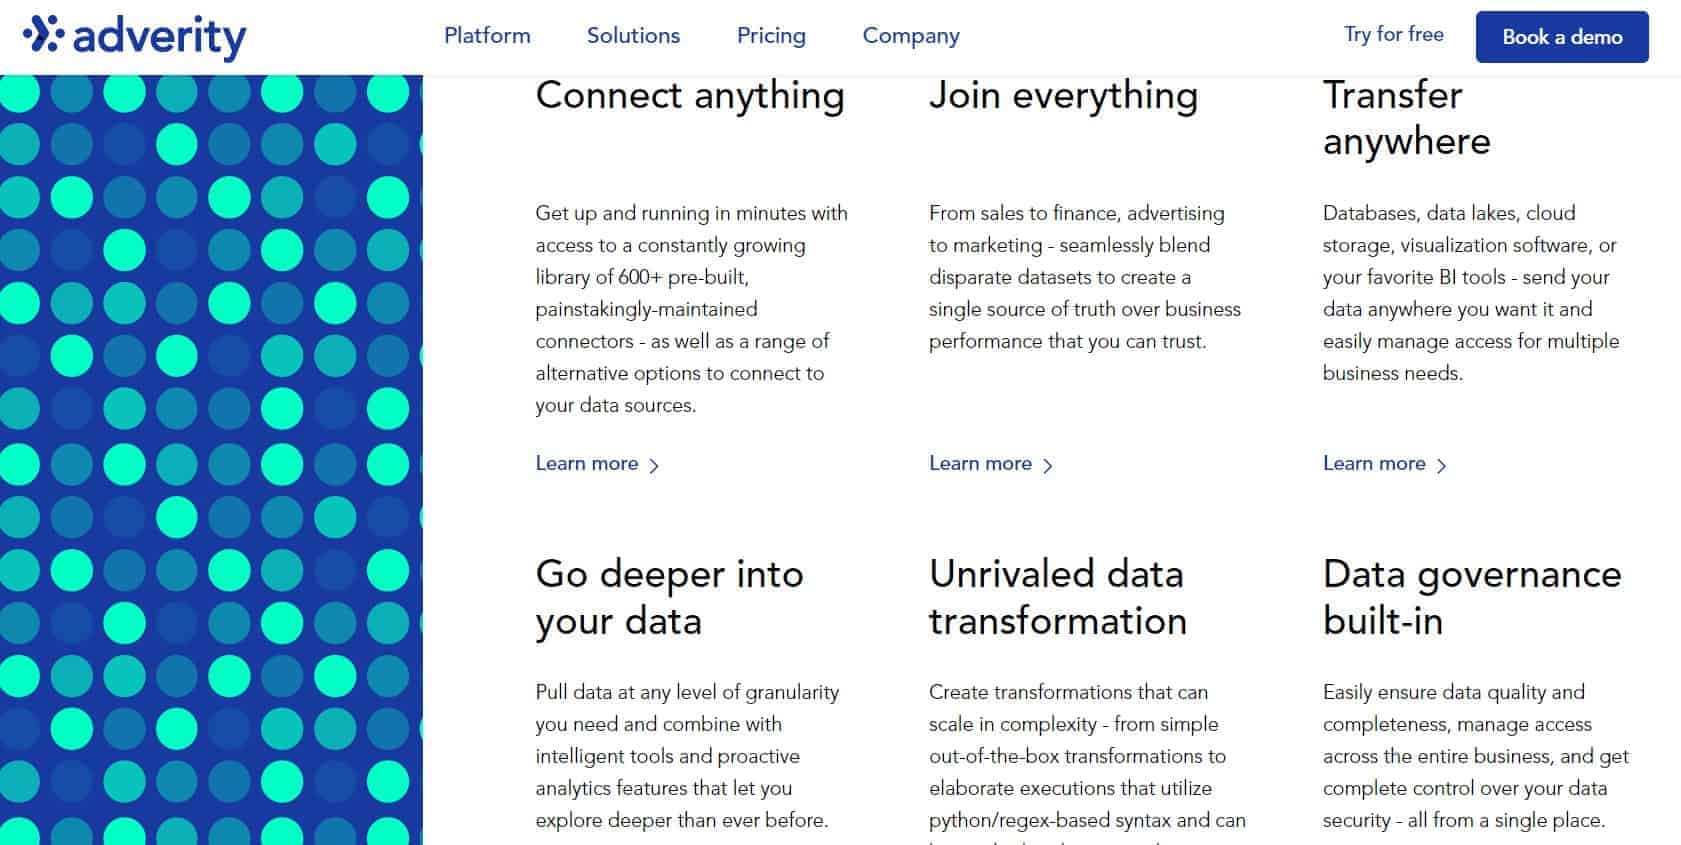
Adverity is an all-in-one marketing analytics platform that enables businesses to make data-driven decisions.
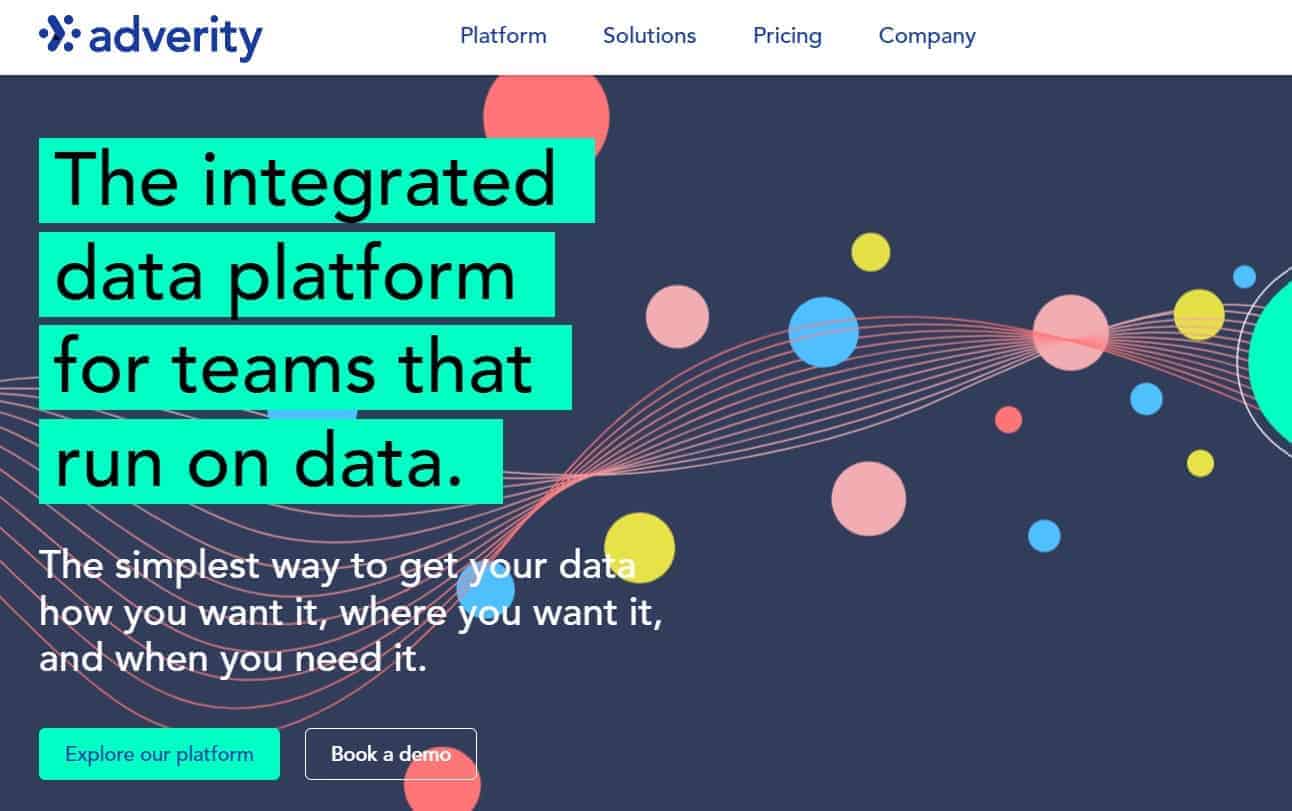
Using this tool, marketers can collect and organize data from various sources into a single platform.
This simplifies the process of monitoring the effectiveness of marketing campaigns across multiple channels.
Key Features:
Data Integration: Adverity enables users to integrate data from multiple sources such as social media, web analytics, and email marketing platforms.
Automated Data Cleansing: The tool automatically cleanses data to guarantee accuracy and currency.
Customizable Dashboards: Adverity allows users to create custom dashboards to track KPIs and performance metrics.
AI-Powered Insights: It provides AI-powered insights that help users to uncover hidden patterns and trends in their data.
What I like (pros):
One of the things I like about Adverity is its ability to automate data cleansing.
By using this feature, you can save a significant amount of time and also guarantee that the data remains precise and current.
I also appreciate the AI-powered insights, which provide valuable information that would be difficult to uncover manually.
How to Use:
- To use Adverity, you first need to connect your data sources.
- This can be done using pre-built connectors or through custom integrations.
- Once the data is integrated, you can create custom dashboards to track KPIs and performance metrics.
- You can also use AI-powered insights to uncover hidden patterns and trends in your data.
Pricing:
Adverity’s pricing is based on a custom quote system.
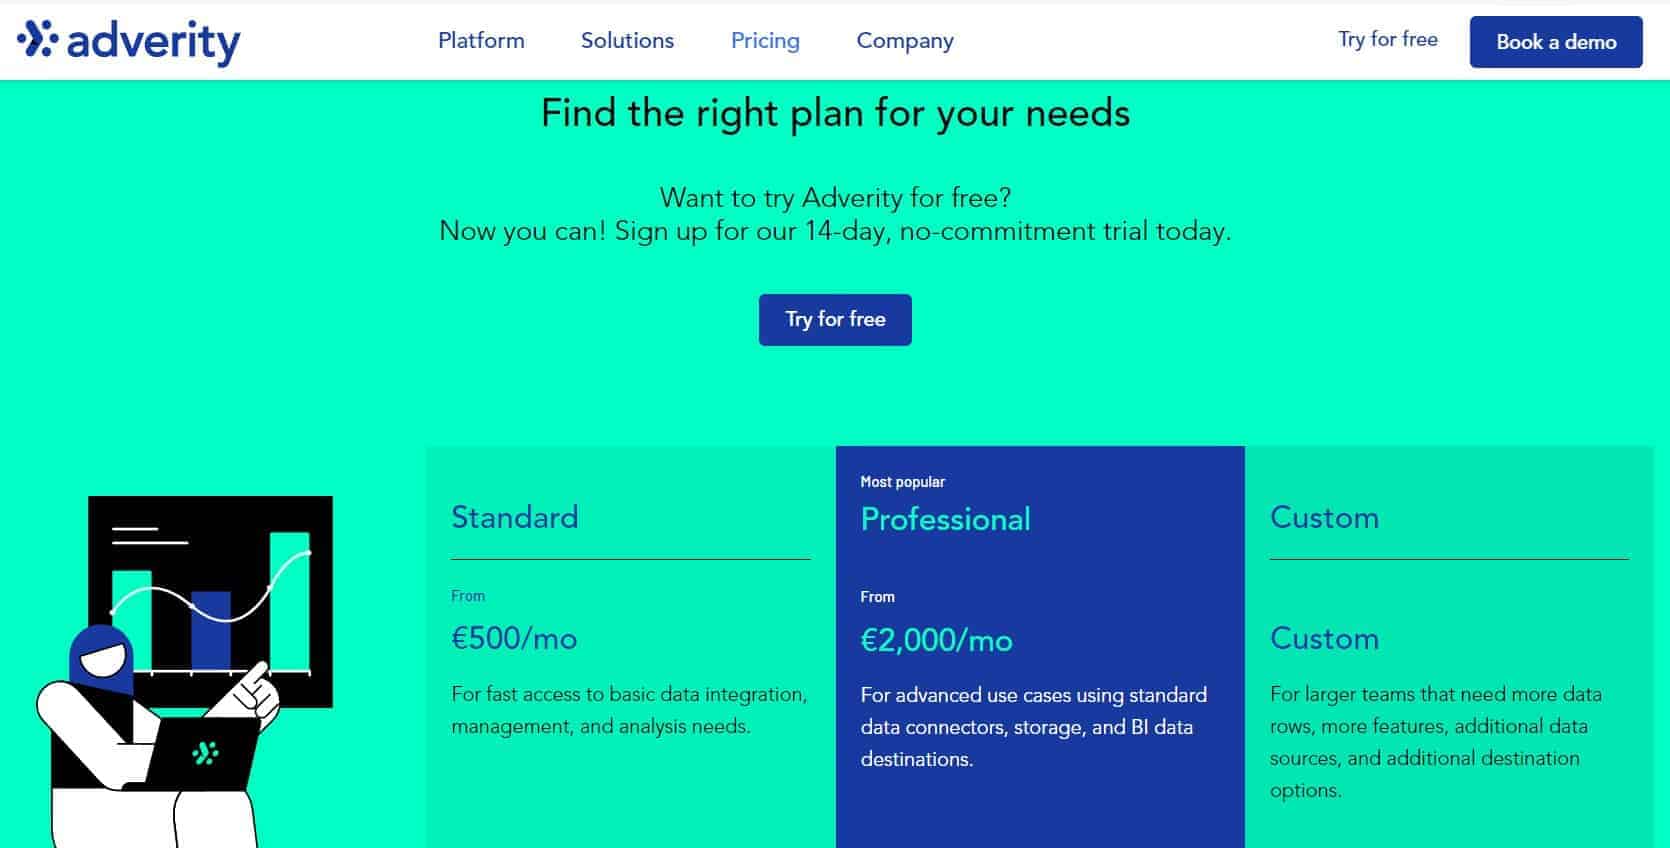
The cost is determined based on the quantity of data sources, volume of data, and level of support needed.
While the pricing can be high, the platform offers a lot of value for businesses that require a comprehensive marketing analytics solution.
Bottom Line:
Adverity is an excellent platform for businesses that need to integrate and analyze data from multiple sources.
Its automated data cleansing and AI-powered insights features are particularly impressive.
While the pricing can be steep, the platform offers a lot of value for businesses that require a comprehensive marketing analytics solution.
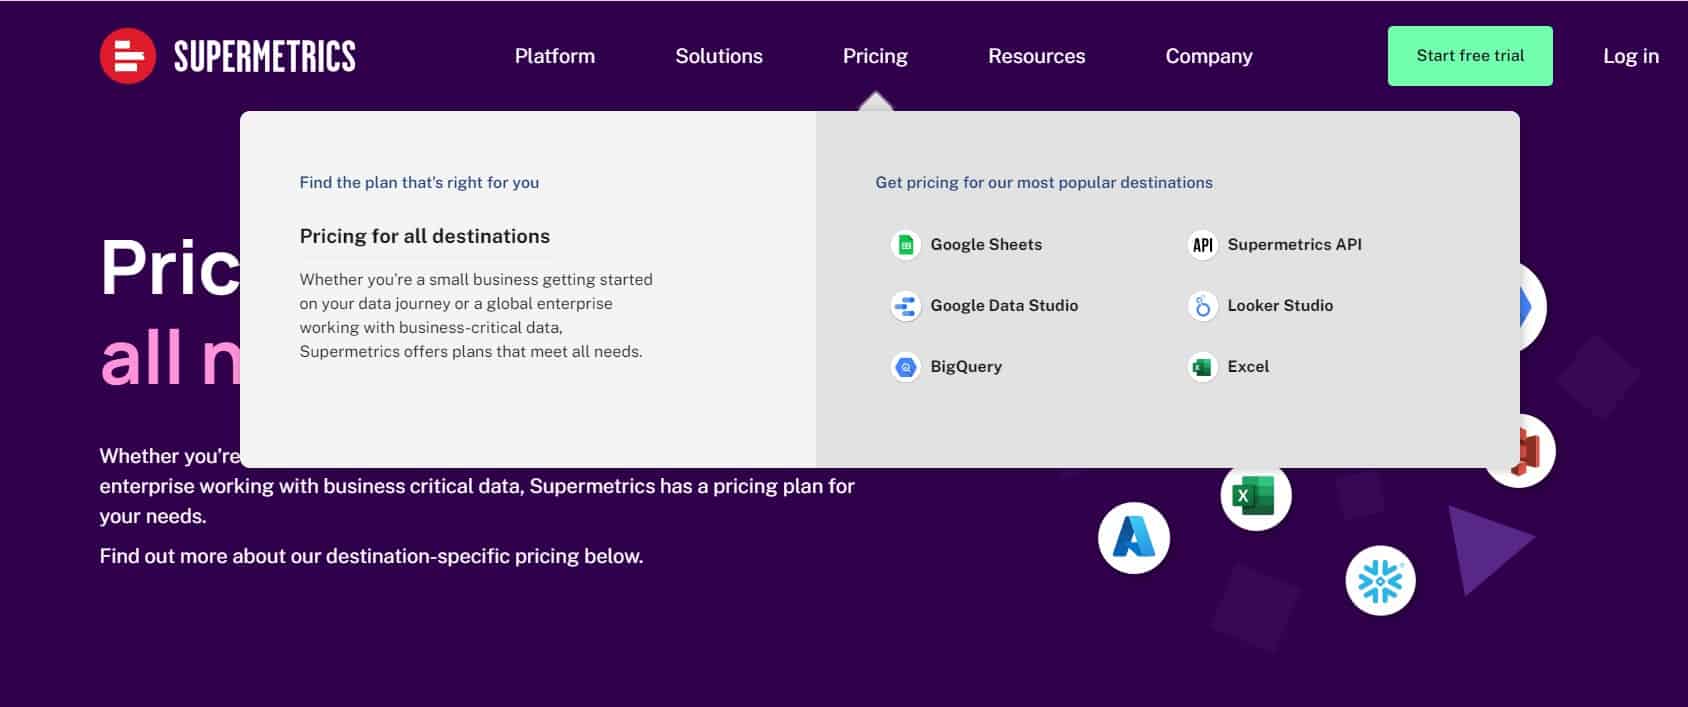
4. Supermetrics
Supermetrics is a marketing analytics tool connecting various data sources, including Google Analytics, Facebook, LinkedIn, and many more.
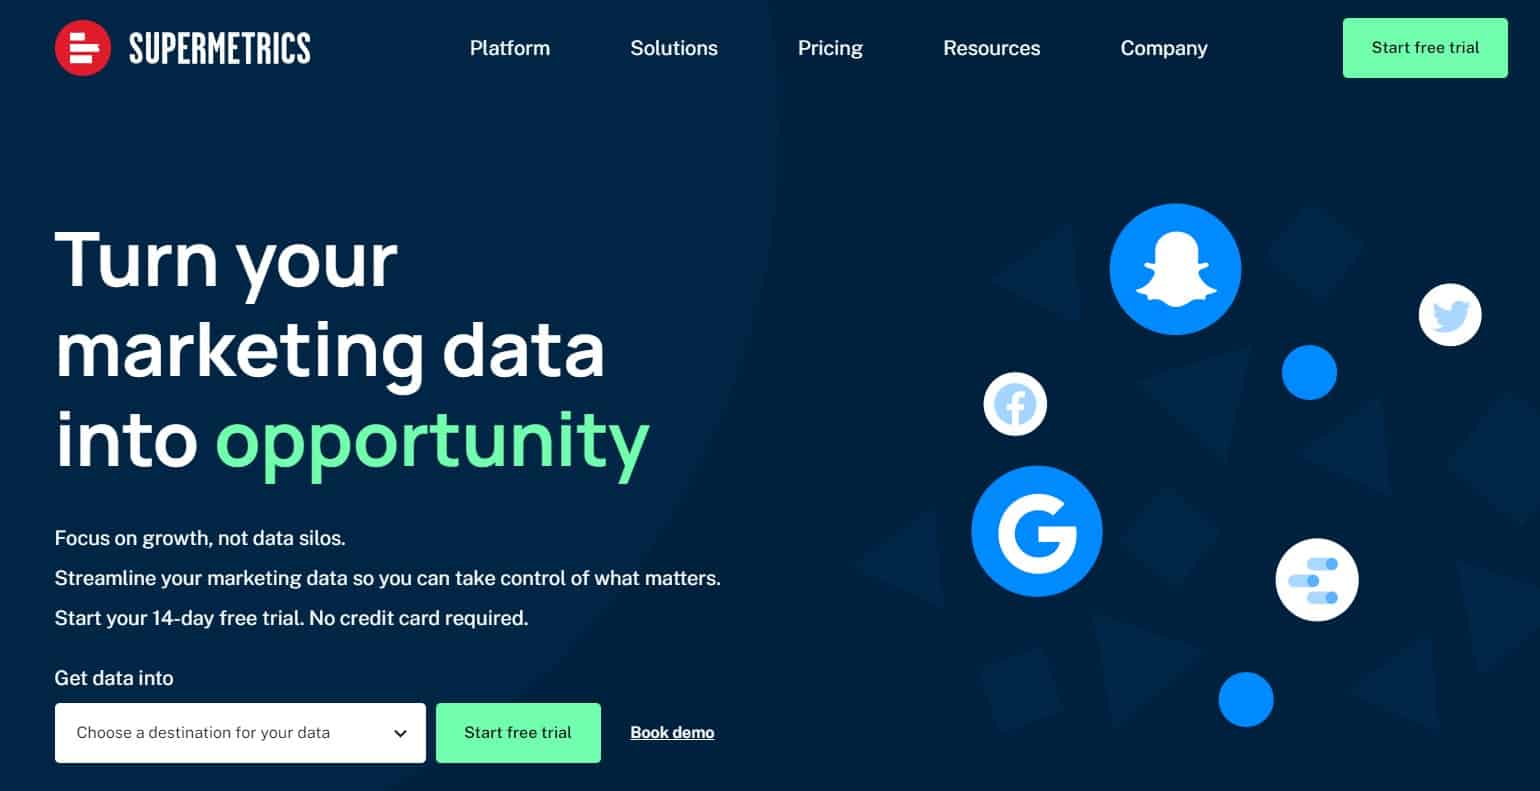
It helps you bring your marketing data into one place, modify it, and create a visual representation of the information.
This enables you to make informed decisions and improve your marketing campaigns.
Key Features:
- Data integration from multiple sources: It integrates with over 50 data sources, including popular platforms like Google Analytics, Google Ads, Facebook, LinkedIn, and more.
- Customizable data queries: You can create custom queries to extract specific data from your various data sources.
- Data visualization and reporting: It provides various tools for visualizing and reporting data to facilitate presenting information clearly and effectively.
- Automatic data refresh: To keep your data up-to-date, you have the option to establish schedules for automatic data refresh.
What I like:
Easy to use: It has an intuitive user interface that makes it easy to set up data sources and create custom queries.
Time-saving: You can quickly import and transform data from multiple sources into one platform, saving time and effort.
Great customer support: It offers excellent customer support, with a team of experts ready to help with any questions or issues you may have.
How to use:
Before using it, you must create an account and link your data sources.
Once your data sources are connected, you can start creating custom queries and visualizations.
For example, you can create a custom query to extract data from Google Analytics and Facebook Ads, then use Supermetrics’ reporting tools to visualize the data and identify trends or insights.
Pricing:
The tool has different pricing plans with the Basic plan starting at $49 per month.
The Pro and Super Pro plans have more features and data sources but are more expensive.
Bottom Line:
It is a marketing analytics tool that lets you integrate and visualize data from multiple sources.
It’s a great option for businesses and marketers who need to manage various data sources, but some users may find the pricing a bit expensive.
5. Whatagraph
Whatagraph is a marketing analytics tool that allows you to turn complex marketing data into easy-to-understand visual reports.
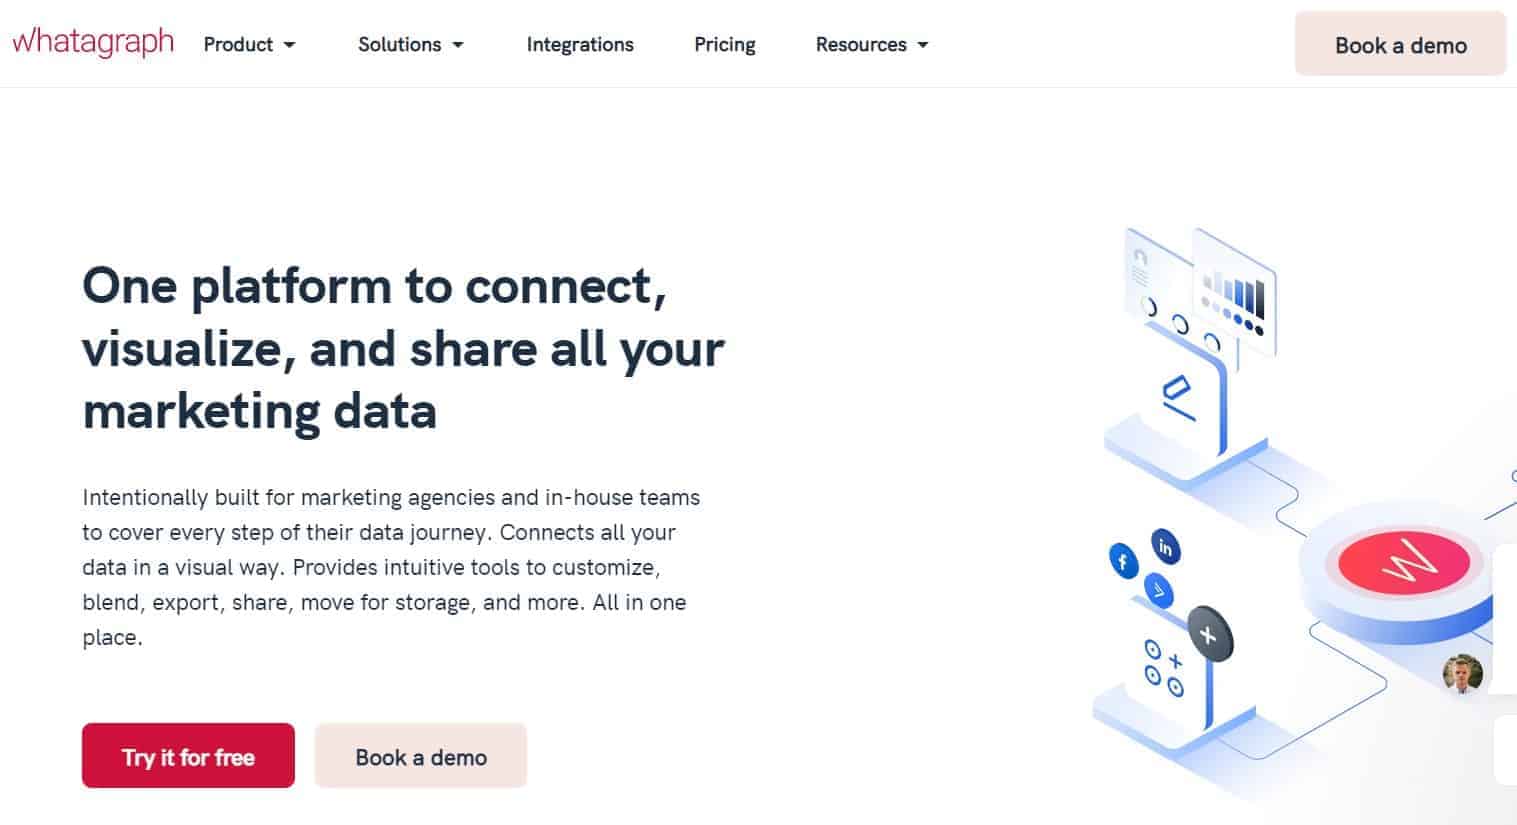
The marketing platform can help you reach customers through various channels such as social media, email marketing, search engine optimization, and pay-per-click advertising.
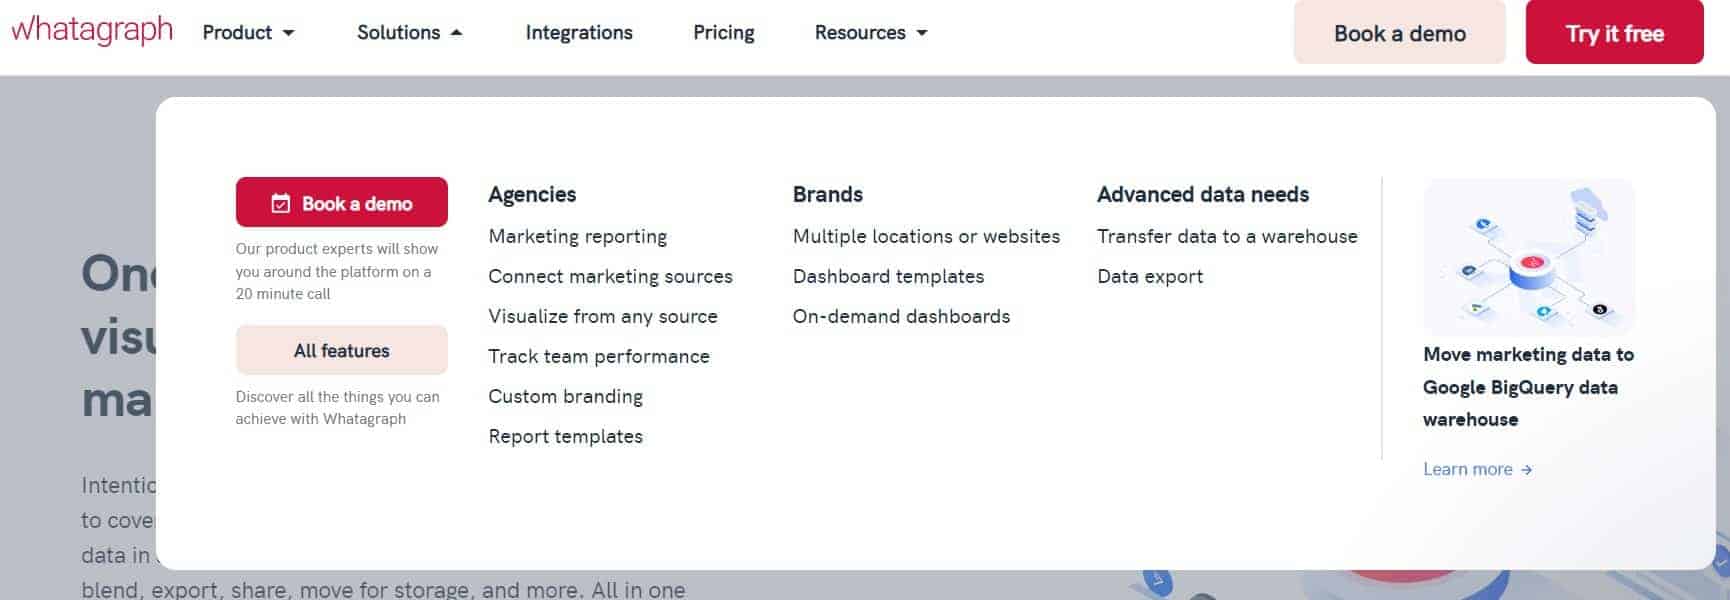
Key Features:
- Customizable report templates: Whatagraph offers a range of report templates that you can customize to fit your brand and your specific reporting needs.
- Integration with multiple data sources: You can connect Whatagraph to various data sources, including Google Analytics, Facebook Ads, and Mailchimp, to gather all your data in one place.
- Automated reporting: You have the option to arrange for automated reports to be produced and delivered to you and your team on a routine basis.
- Real-time data tracking: Whatagraph provides real-time data tracking and alerts, so you can respond quickly to any changes in your campaigns.
What I Like (Pros):
Easy to use: It’s user-friendly interface makes it easy to create and customize reports, even if you’re not a data expert.
Comprehensive reporting: It allows you to create comprehensive reports that cover multiple marketing channels, so you can get a complete view of your marketing performance.
Automated reporting: With Whatagraph, you can automate your reporting, saving you time and effort.
What I Dislike (Cons):
Limited customization options: While Whatagraph does offer customizable templates, there are limitations to how much you can customize the reports.
Limited data sources: Whatagraph can integrate with various data sources, but it does not have integration with some significant ones like LinkedIn Ads and Instagram.
How to Use:
Suppose you aim to generate a report that monitors how well your social media platforms are doing.
With Whatagraph, you can create a custom report template that includes data from Facebook, Twitter, and LinkedIn.
- You can set up automated reporting to receive weekly reports on your social media performance, including engagement rates, reach, and click-through rates.
If you see a sudden decrease in engagement on one of your platforms, you should promptly react and implement modifications to enhance its performance.
Pricing:
Whatagraph offers a range of pricing plans, starting at $119 per month for the Basic plan, which includes five report templates, three data sources, and 10 integrations.
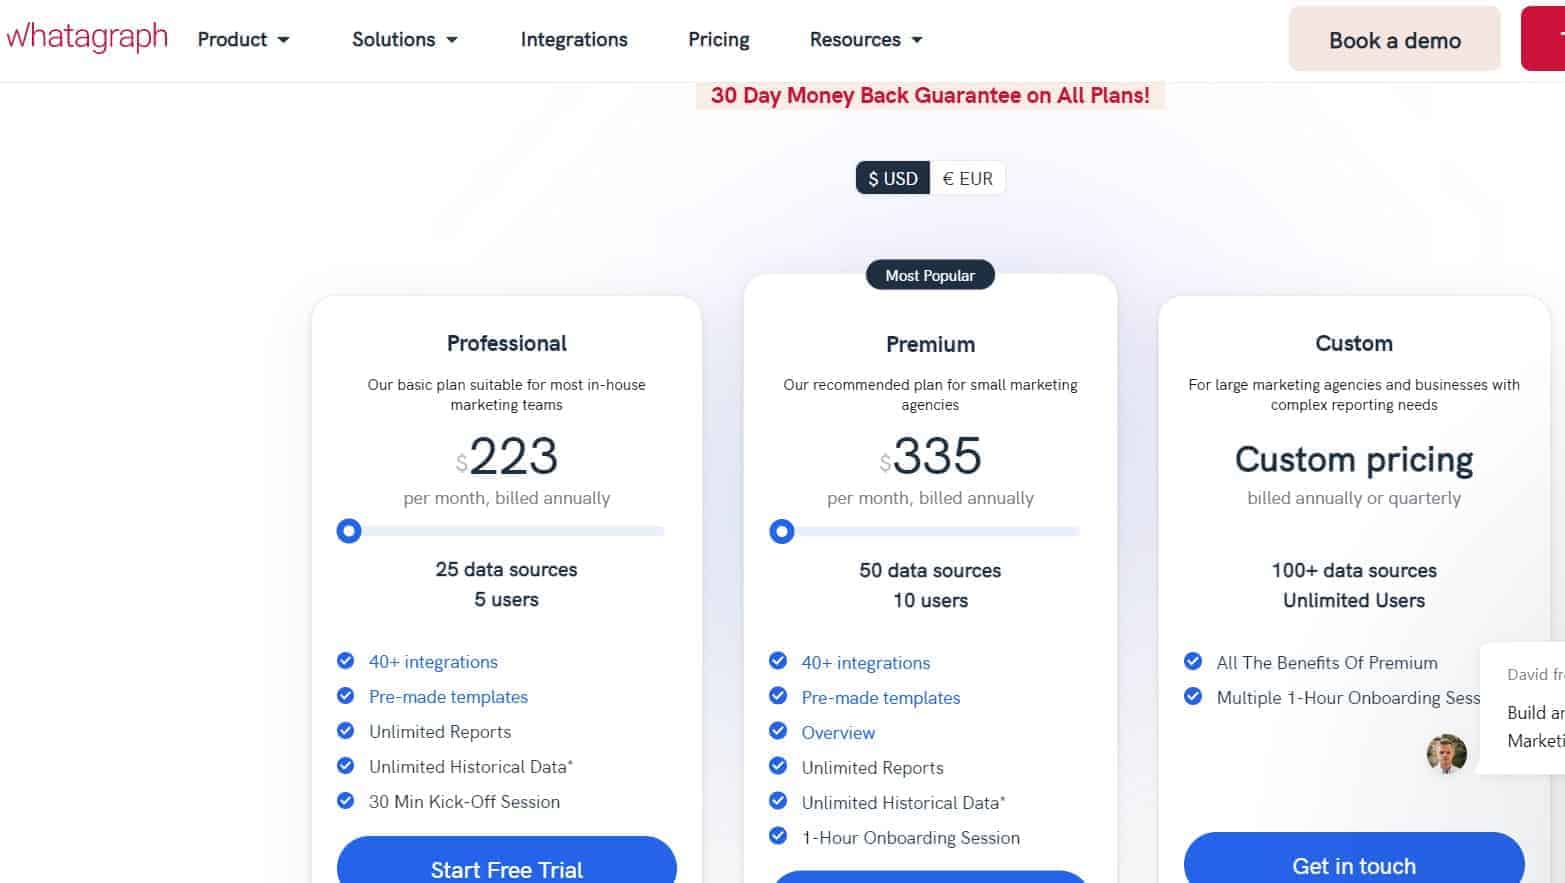
The Premium plan, which costs $335 per month, includes 20 report templates, 50 data reports, and 40+ integrations.
Bottom Line:
Overall, Whatagraph is a great tool for marketers who want to create easy-to-understand reports that cover multiple marketing channels.
While it has some limitations in terms of customization and data sources, it’s user-friendly and offers comprehensive reporting options.
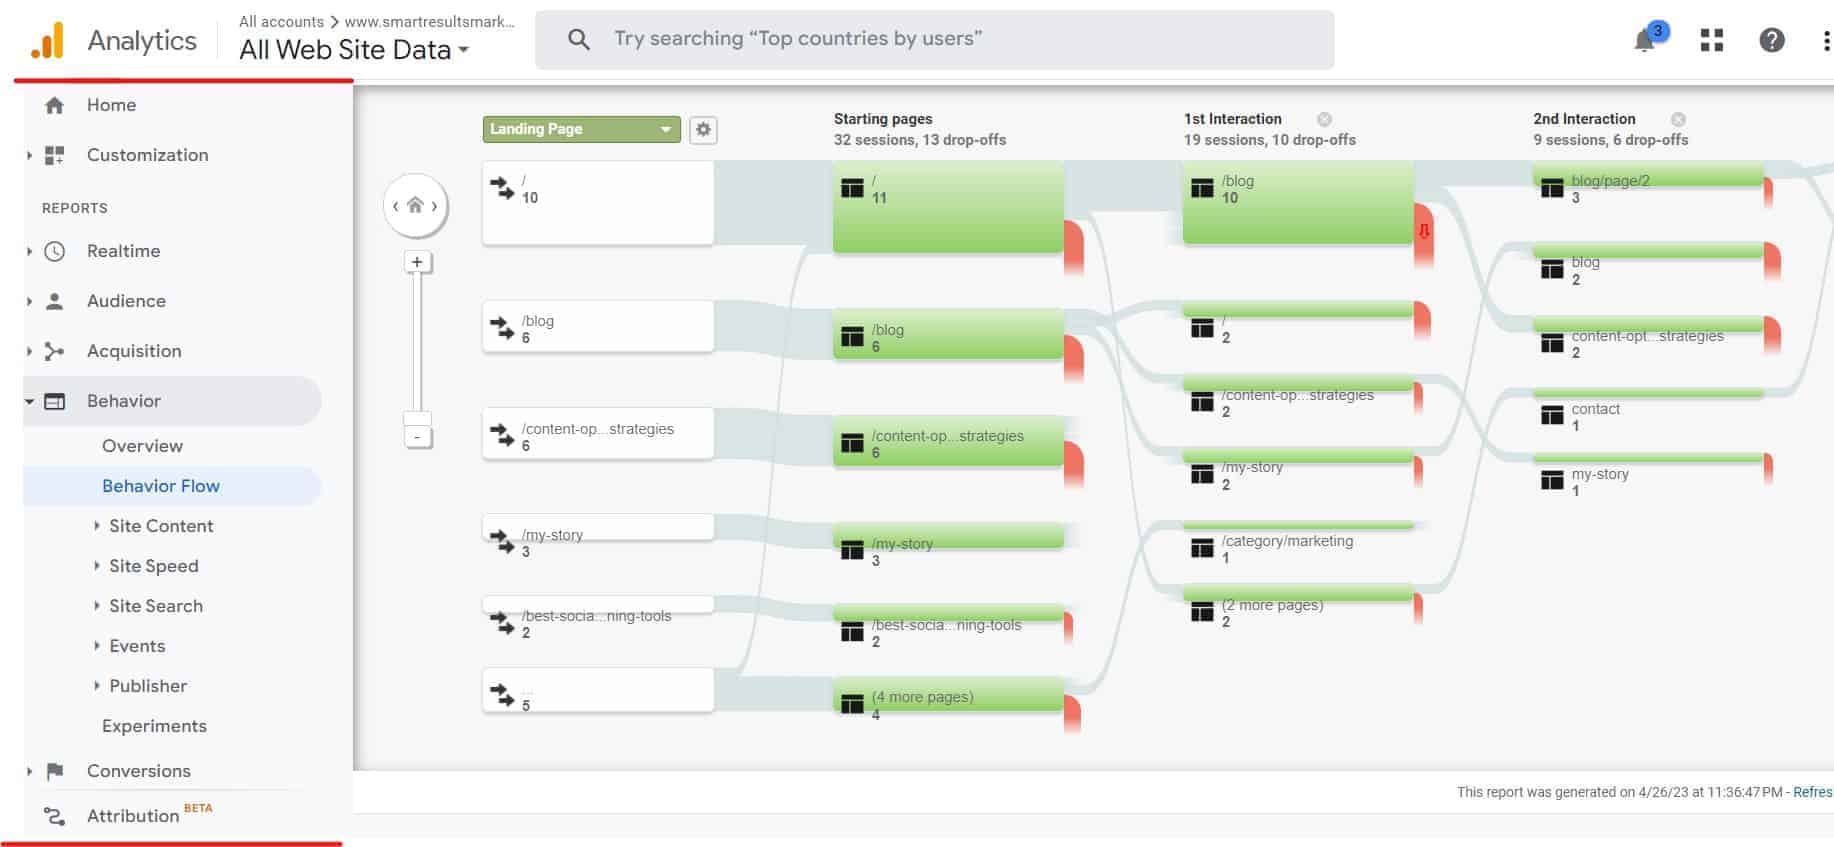
6. Google Analytics
Google Analytics is a widely used tool for analyzing and tracking website traffic.
It assists website owners and marketers in keeping track of their website visitors and understand their behavior.
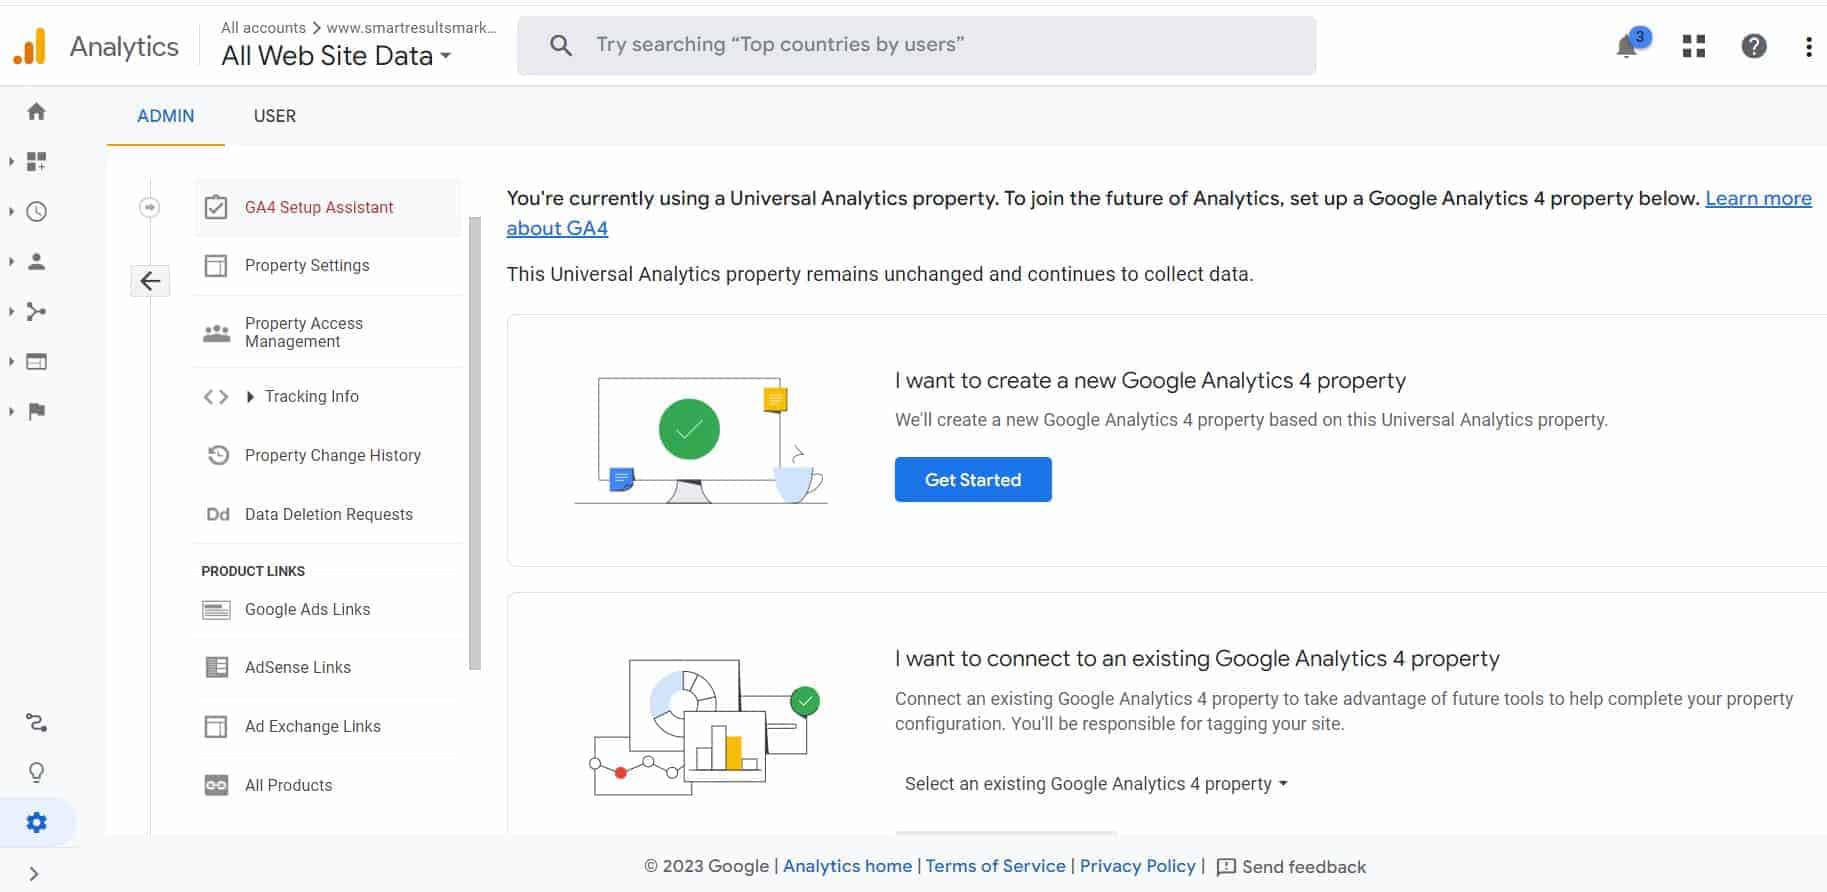
It provides valuable insights into user behaviour, traffic sources, and conversion rates, among other metrics.
Key Features:
- Real-time data: Google Analytics displays real-time information about visitors to your website, enabling you to monitor how users behave in real-time.
- Traffic sources: You can see where your website visitors are coming from, including organic search, paid search, social media, and referral traffic.
- Audience demographics: Google Analytics provides insights into the age, gender, and interests of your website visitors.
- Conversion tracking: Conversion tracking allows you to monitor how visitors are engaging with your website, such as completing a purchase, submitting forms or carrying out other desired actions.
- Custom reporting: You can use Google Analytics to generate personalized reports that monitor the most relevant metrics for your business.
What I Like (Pros):
- Free to use: Google Analytics is a free tool, which makes it accessible to businesses of all sizes.
- Easy to set up: Setting up Google Analytics on your website is a simple process that can be achieved by using a plugin or coding a few lines..
- Robust data: By using Google Analytics, you can access ample information about the individuals visiting your website and their actions, which can assist you in making decisions based on data.
- Integrations: You can link Google Analytics to different tools and platforms, including Google Ads, Google Search Console, and Google Data Studio.
What I Dislike (Cons):
- Data sampling: Google Analytics may use data sampling if you have a lot of data. This can make it easier to handle, but it can also result in less precise insights.
- Data privacy concerns: Google Analytics collects user data, which may be a concern for some users.
How to Use :
If you’re running an e-commerce website, you may want to monitor the number of people who are completing purchases.
To do this, you can set up a conversion goal in Google Analytics.
To track user behaviour, Google Analytics can monitor the number of people who complete a desired action, such as purchasing or filling out a form, based on your predefined settings.
By utilizing this data, you can enhance your website and marketing strategies and boost your conversion rates.
Pricing:
Businesses of any size can use Google Analytics for free, making it a practical choice due to its accessibility.
Bottom Line:
I highly recommend Google Analytics for businesses and marketers looking to track and analyze their website traffic.
Using this tool for making data-driven decisions is highly beneficial because it provides a wealth of data.
In addition, it is free to use, making it suitable for businesses of all sizes.
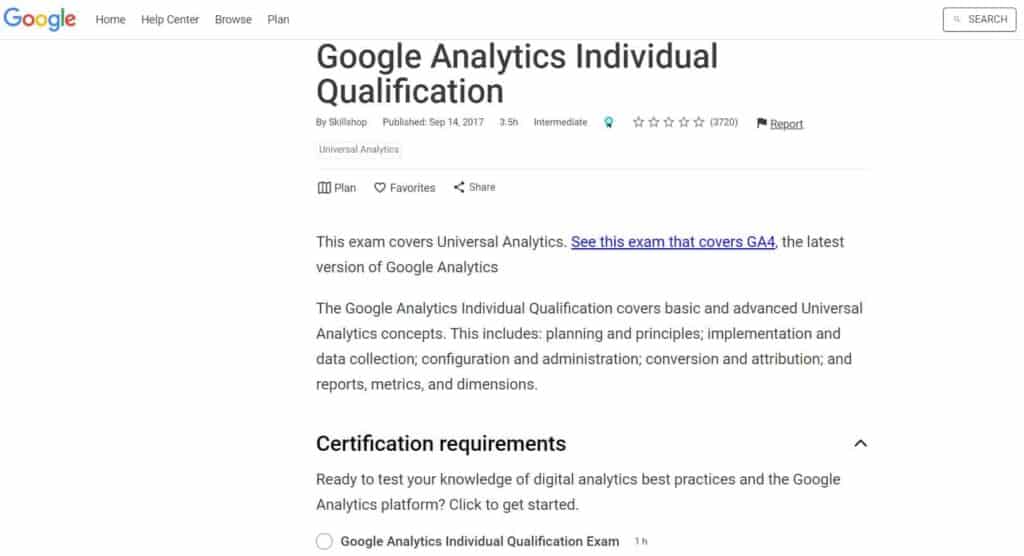
For effective usage, I recommend taking their course and exam on Google Skillshop.
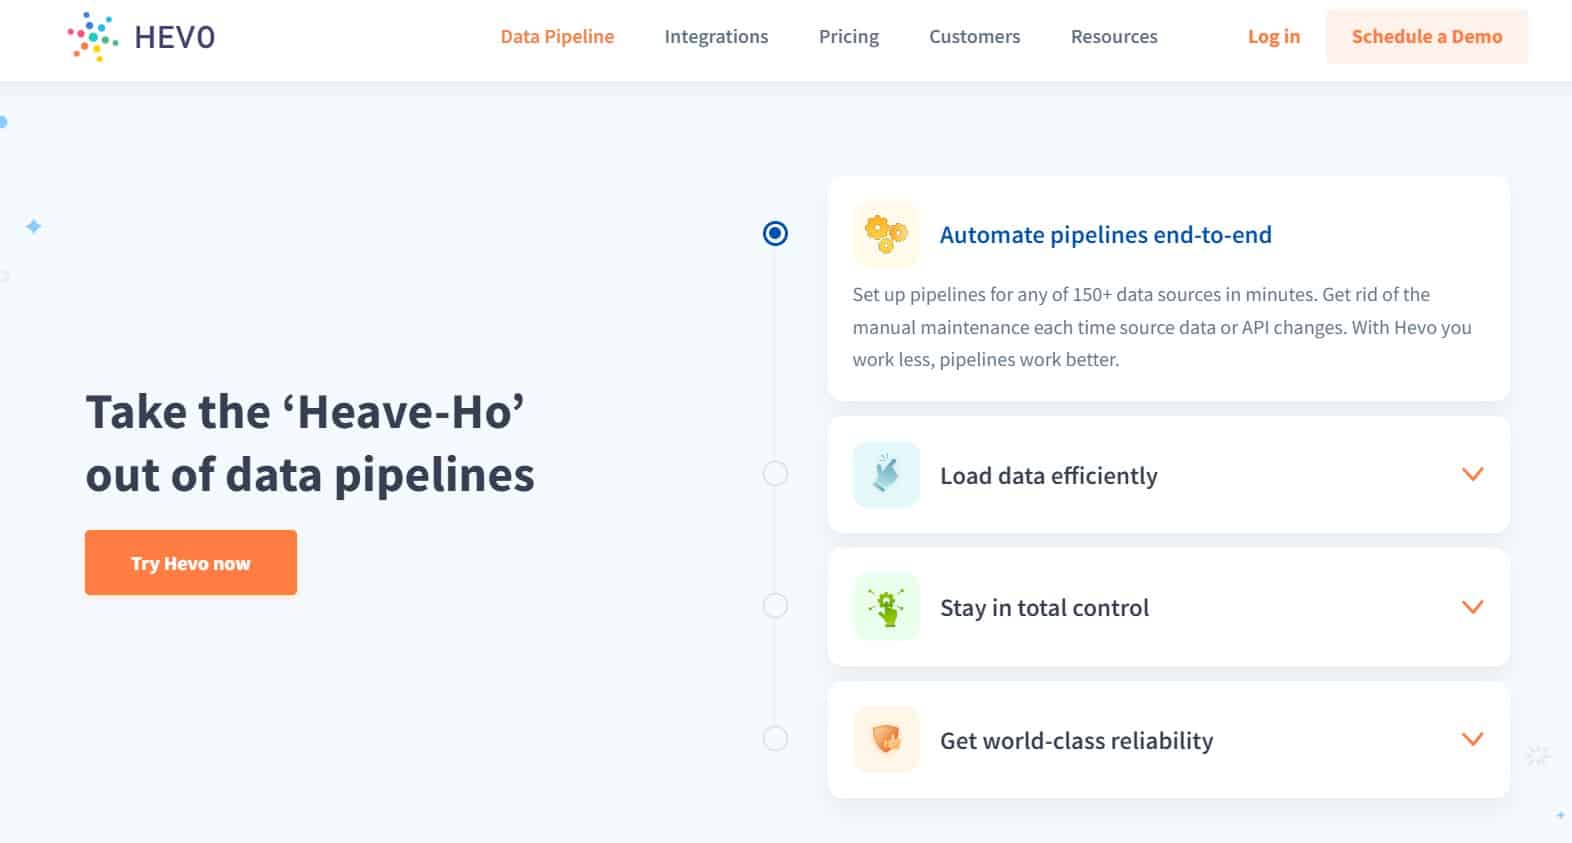
7. Hevo Data
Hevo Data is a cloud-based ETL tool that enables businesses to integrate their data from various sources without writing any code.
The platform offers a user-friendly interface that allows you to gather, arrange, and merge data from various sources like databases, cloud applications, and APIs into one data warehouse.
Key Features:
- Easy-to-use interface: It provides a user-friendly interface that helps businesses integrate data from various sources with ease.
- Real-time data integration: Hevo Data offers real-time data integration, which ensures that businesses always have access to the latest data.
- Auto-mapping: The platform automatically maps the data from different sources, which saves businesses a lot of time and effort.
- Pre-built connectors: It provides pre-built connectors for various sources such as databases, cloud applications, and APIs.
What I like (pros):
- Ease of use: Hevo Data is very easy to use, even for non-technical users like myself. The user-friendly interface and pre-built connectors make data integration a breeze.
- Real-time data integration: With Hevo Data, I never have to worry about stale data as the platform provides real-time data integration.
- Cost-effective: Hevo Data’s pricing model is based on the volume of data, which makes it cost-effective for small to medium-sized businesses.
What I dislike (cons):
- Limited customization: Hevo Data provides pre-built connectors for various sources, which can limit customization options for businesses with specific data integration needs.
- Lack of advanced features: While Hevo Data is a great tool for simple data integration tasks, it may not be suitable for businesses that require advanced features such as data transformation.
How to use Hevo Data:
Suppose I intend to incorporate the customer data from my e-commerce platform into my data warehouse.
With Hevo Data, I can easily connect to my e-commerce platform using the pre-built connector, map the data, and start syncing it to my data warehouse in real time.
I can also set up filters to ensure that only relevant data is integrated into my data warehouse.
Pricing:
Hevo Data’s pricing is based on the volume of data that businesses need to integrate.
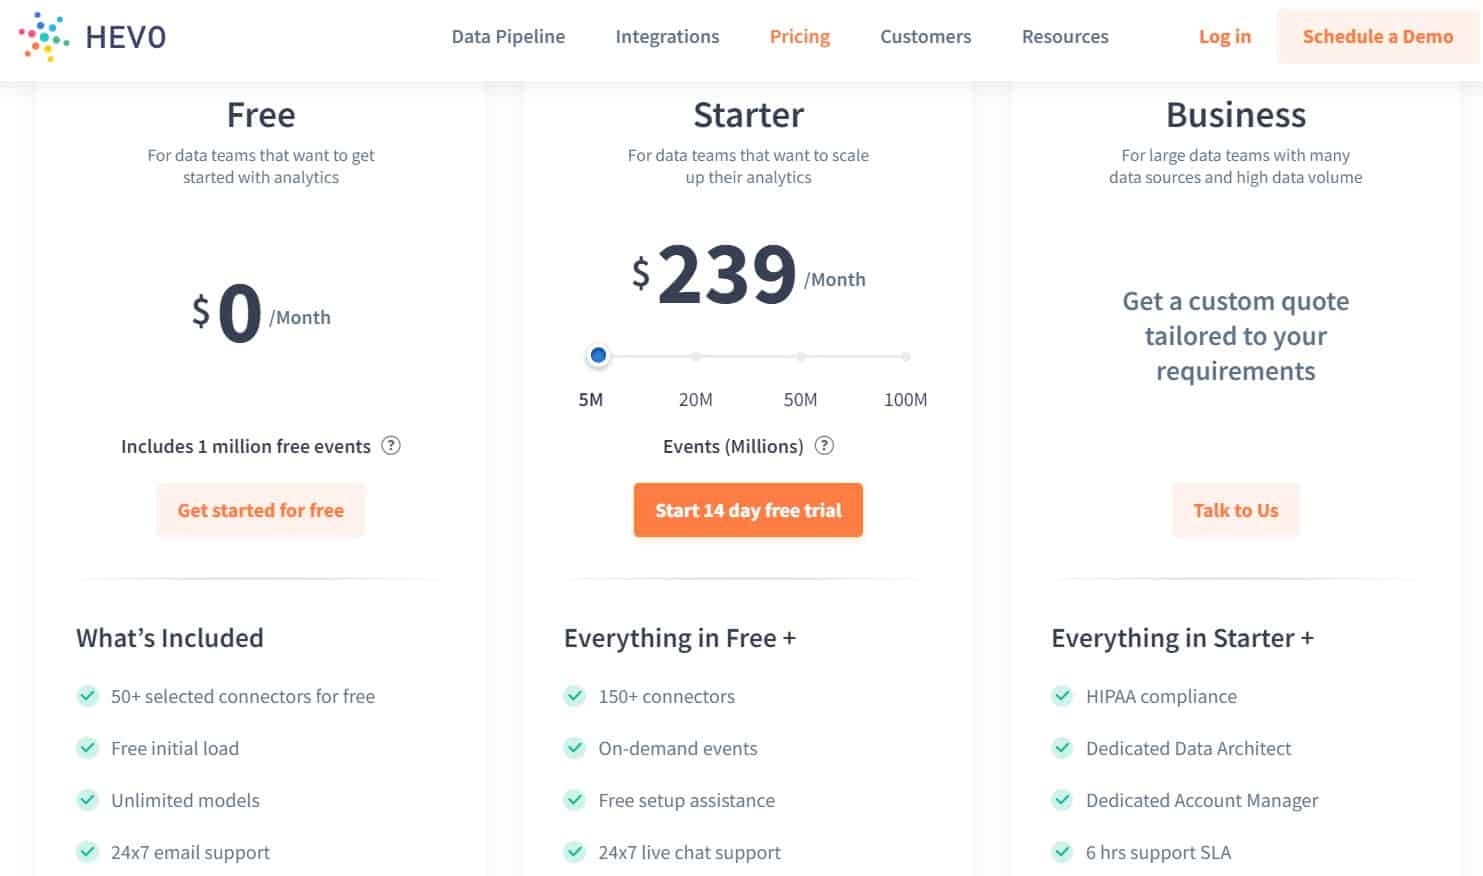
The platform offers a free trial, after which businesses can choose from various pricing plans based on their needs.
Bottom line:
Overall, I find Hevo Data to be a great tool for businesses that need to integrate data from multiple sources without writing any code.
Small to medium-sized businesses can benefit from the platform’s user-friendly interface, cost-effectiveness, and real-time data integration.
However, businesses with specific data integration needs or those that require advanced features may need to consider other options.
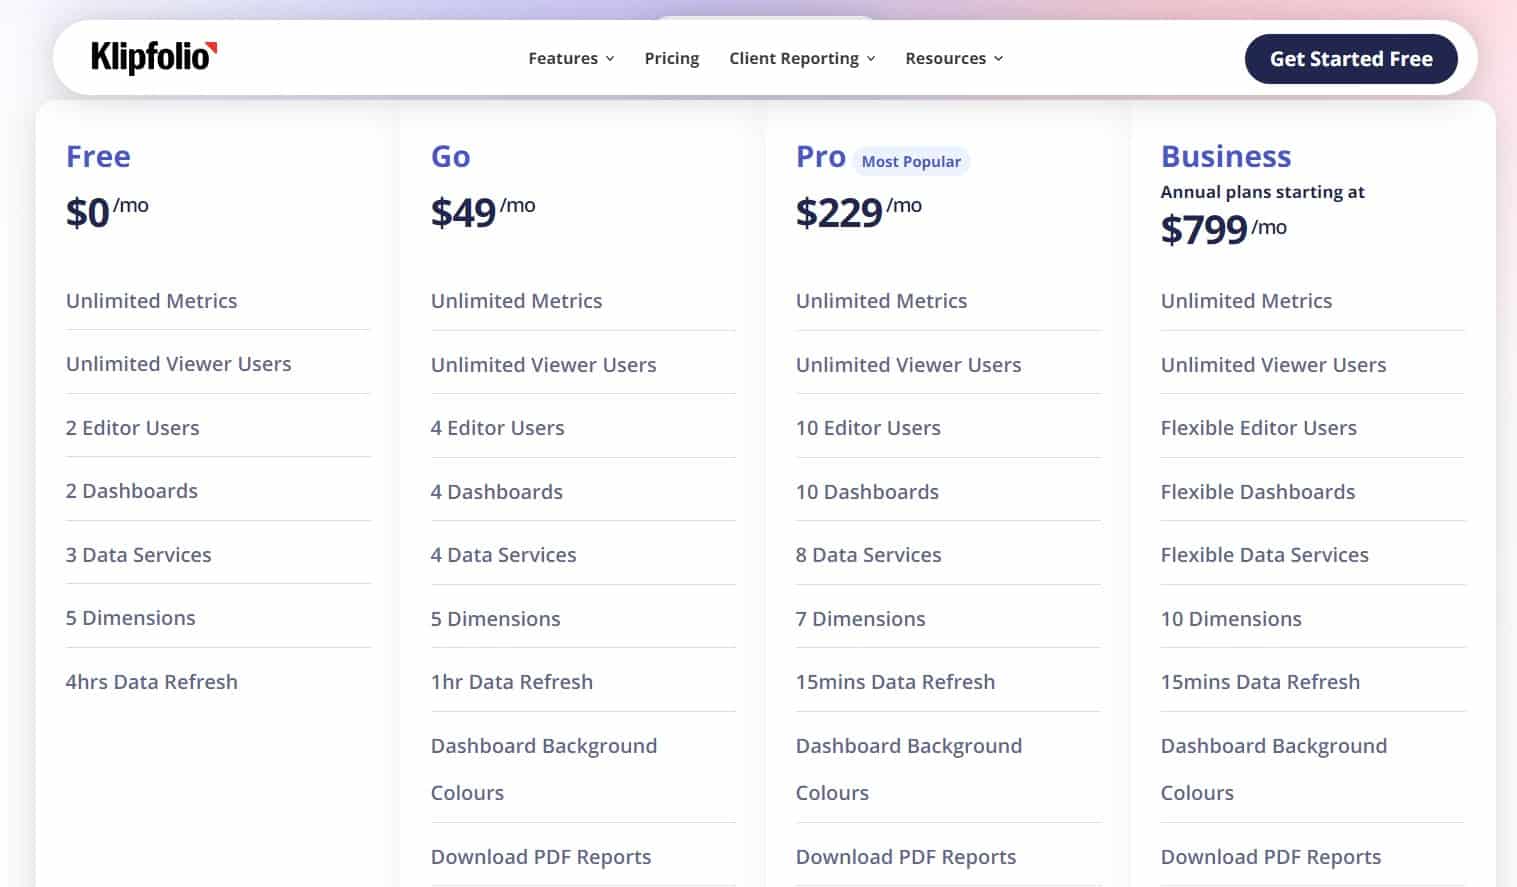
8. Klipfolio
Klipfolio is a tool for businesses to visualize and track their key performance indicators (KPIs) in real-time.
It is cloud-based and suitable for businesses of all sizes.
Klipfolio allows you to access more than 400 data sources, such as spreadsheets, databases, and cloud services.
You can use this data to create personalized dashboards and visualizations that suit your business requirements.
Key Features:
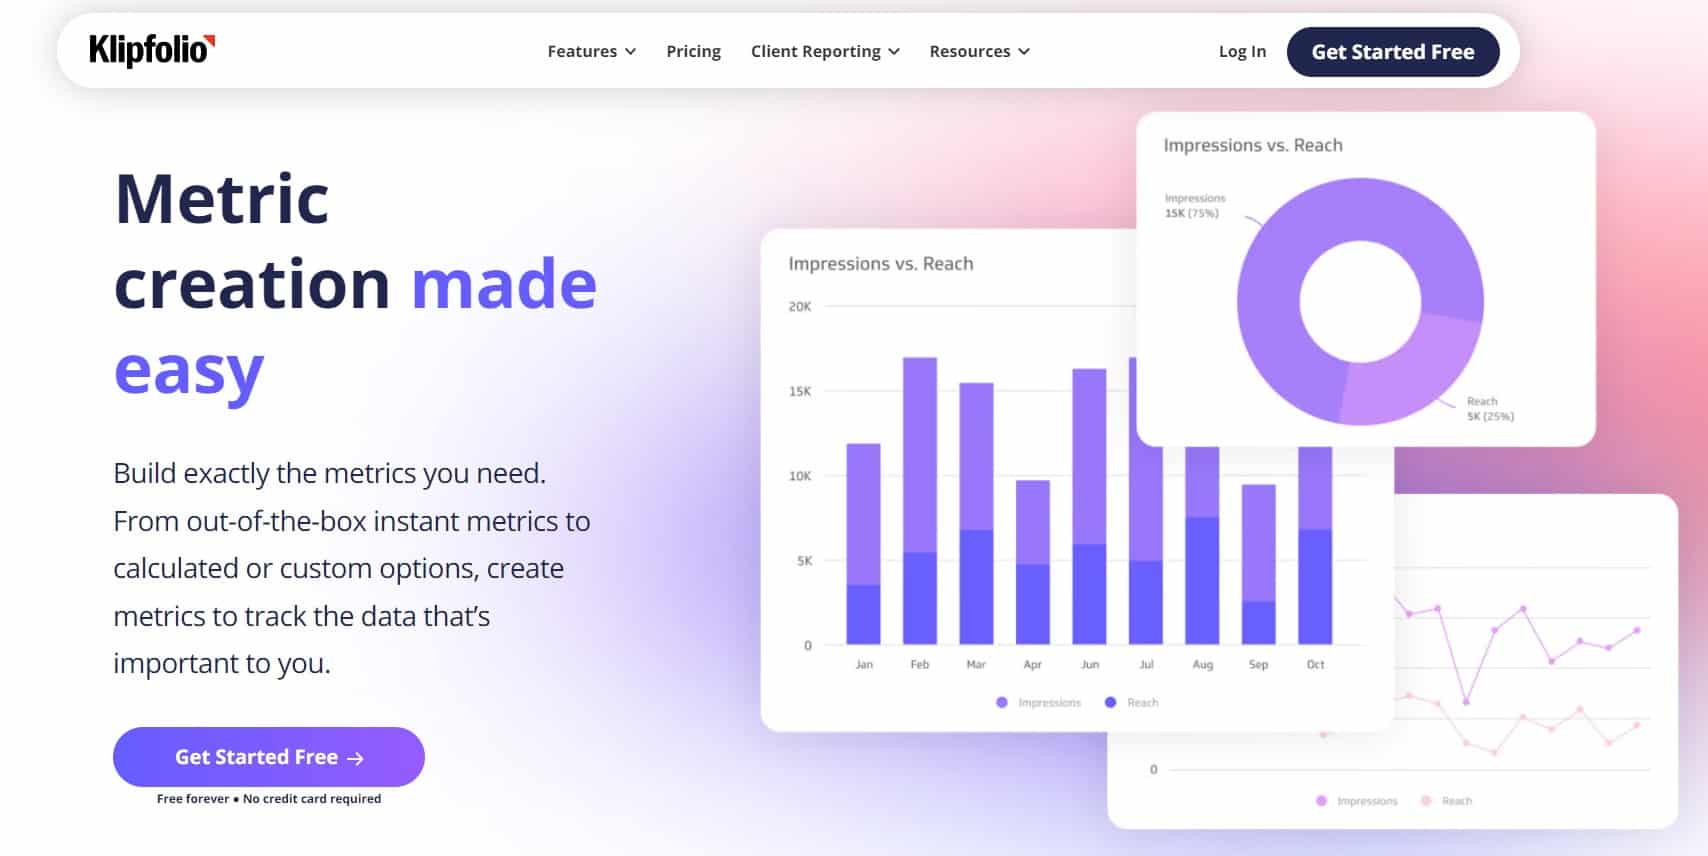
Customizable Dashboards: Klipfolio allows you to create custom dashboards that are tailored to your business needs.
Data Integration: Klipfolio allows you to integrate more than 400 various data sources such as spreadsheets, databases, and cloud services. Then, it consolidates all the data into one platform.
Automated Data Refresh: Klipfolio refreshes your data automatically every few minutes to ensure that you always have access to the latest information.
Collaboration: Klipfolio allows you to share your dashboards and reports with your team members, clients, or stakeholders, and collaborate on your data analysis and visualization projects.
What I Like (pros):
Customizable Dashboard: I love how easy it is to create custom dashboards in Klipfolio.
You have the option to select various visualizations and organize them in whatever manner you prefer to form a complete overview of your company’s data.
Data Integration: Klipfolio’s data integration capabilities are impressive.
You can consolidate your data from over 400 different sources into one platform, which will make it easy for you to analyze and visualize your data.
How to Use:
Suppose you aim to make a personalized dashboard that can monitor your website traffic and social media engagement.
Connect to your data sources: First, you’ll need to connect to your website analytics and social media accounts in Klipfolio.
To create your dashboard, select a visualization type from a range of options including line charts, bar charts, and gauges.
You can arrange these visualizations on your dashboard to create a comprehensive view of your data.
Customize your dashboard: To further customize your dashboard, you can incorporate branding elements such as logos and images.
Share your dashboard: You can share your dashboard with your team members, clients, or stakeholders, allowing you to collaborate on data analysis and visualization projects.
Pricing:
Klipfolio offers a variety of pricing plans, starting at $49/month for up to 4 users and 4 dashboards. The more advanced plans include more users, dashboards, and data sources.
Bottom Line:
Klipfolio is a powerful business intelligence and dashboard tool that can help businesses of all sizes to track and visualize their KPIs in real-time.
Although it may take some effort to learn, the tool’s ability to combine data and create personalized dashboards makes it a valuable investment for companies that require data analysis for decision-making.
9. Improvado
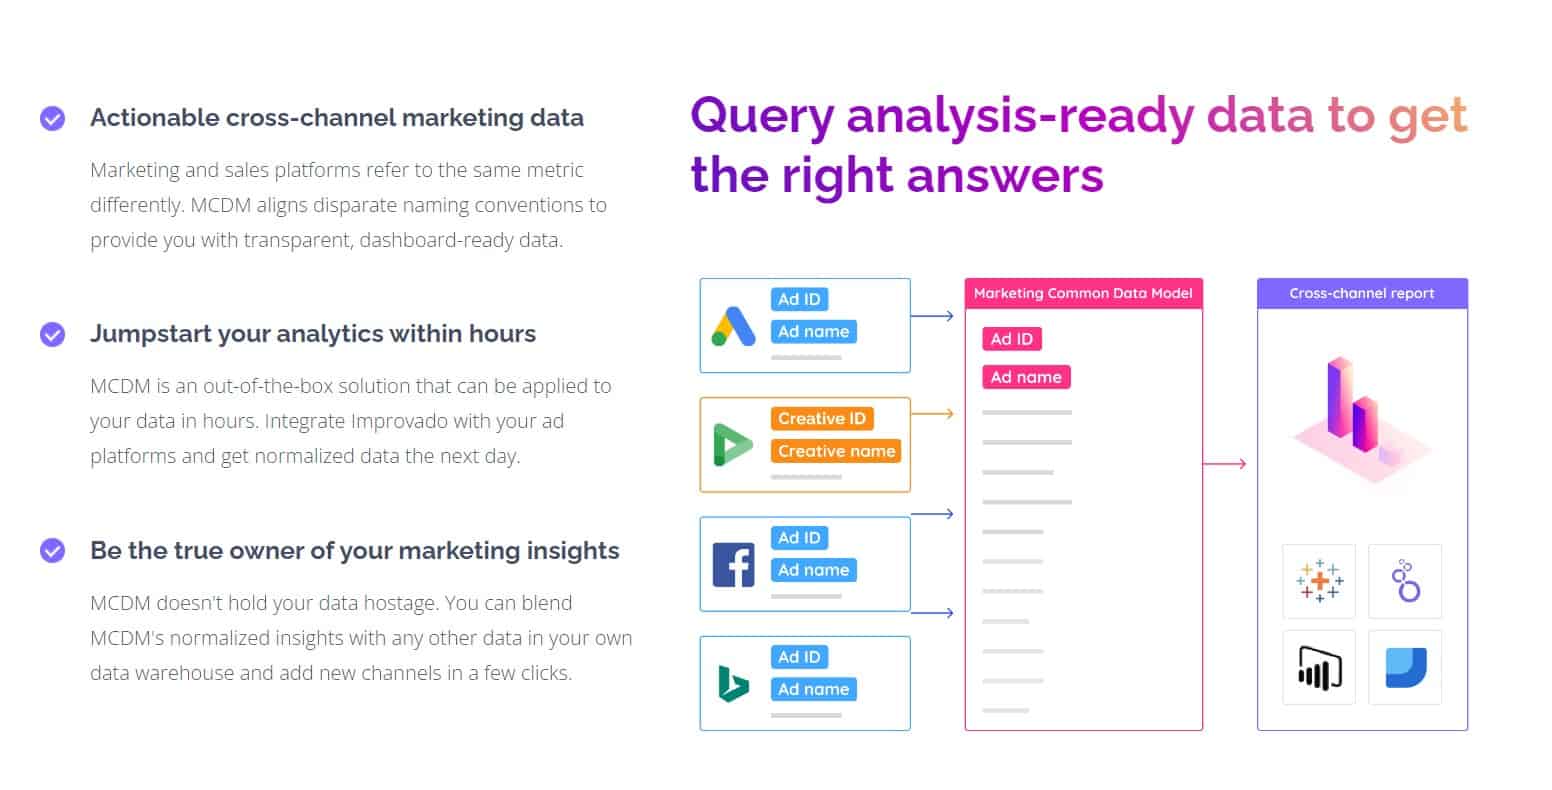
Improvado is a marketing data aggregation and ETL (Extract, Transform, Load) platform that allows businesses to automate their marketing data pipeline.
It helps you collect, consolidate, and visualize your marketing data from various sources, making it easier to analyze and draw insights.
With Improvado, you can connect your data from various channels, including social media, email, CRM, and Google Analytics, among others.
Key Features:
- Customizable dashboards: You can create custom dashboards and reports that meet your specific needs and share them with your team.
- Data mapping and transformation: The interface of Improvado is user-friendly and helps in converting and arranging data from different sources into a convenient format.
- Automated data integration: The platform retrieves data from various sources and refreshes it in real-time, eliminating the requirement for manual data entry.
- Robust security features: Improvado uses advanced security measures to ensure that your data is safe and secure.
- Integrations: Improvado provides a diverse selection of integrations that comprise Facebook Ads, Google Ads, Salesforce, and various others.
What I Like (pros):
- Easy to use: Improvado is user-friendly, and you can easily navigate through the platform even if you’re not a data expert.
- Customizable dashboards: I appreciate that I can create custom dashboards that meet my specific needs and share them with my team.
- Automated data integration: The platform automatically pulls data from different sources, which saves me time and eliminates the need for manual data entry.
- Customer support: The customer support team of Improvado is always available to help with any concerns or queries.
What I Dislike (cons):
- Limited visualization options: Although the platform offers customizable dashboards, the visualization options are limited compared to other marketing analytics tools.
How to Use:
For example, as a marketing manager for an e-commerce store, I would like to monitor the effectiveness of our Facebook ads, Google Ads, and email promotions.
With Improvado, you can connect all these data sources, map and transform the data, and create custom dashboards that display the metrics you want to track.
One way to track ad campaign performance is by creating a dashboard that displays the clicks, impressions, and conversions for each campaign.
Additionally, you can enable alerts that will inform you when a metric exceeds a set threshold, allowing you to promptly respond.
Pricing:
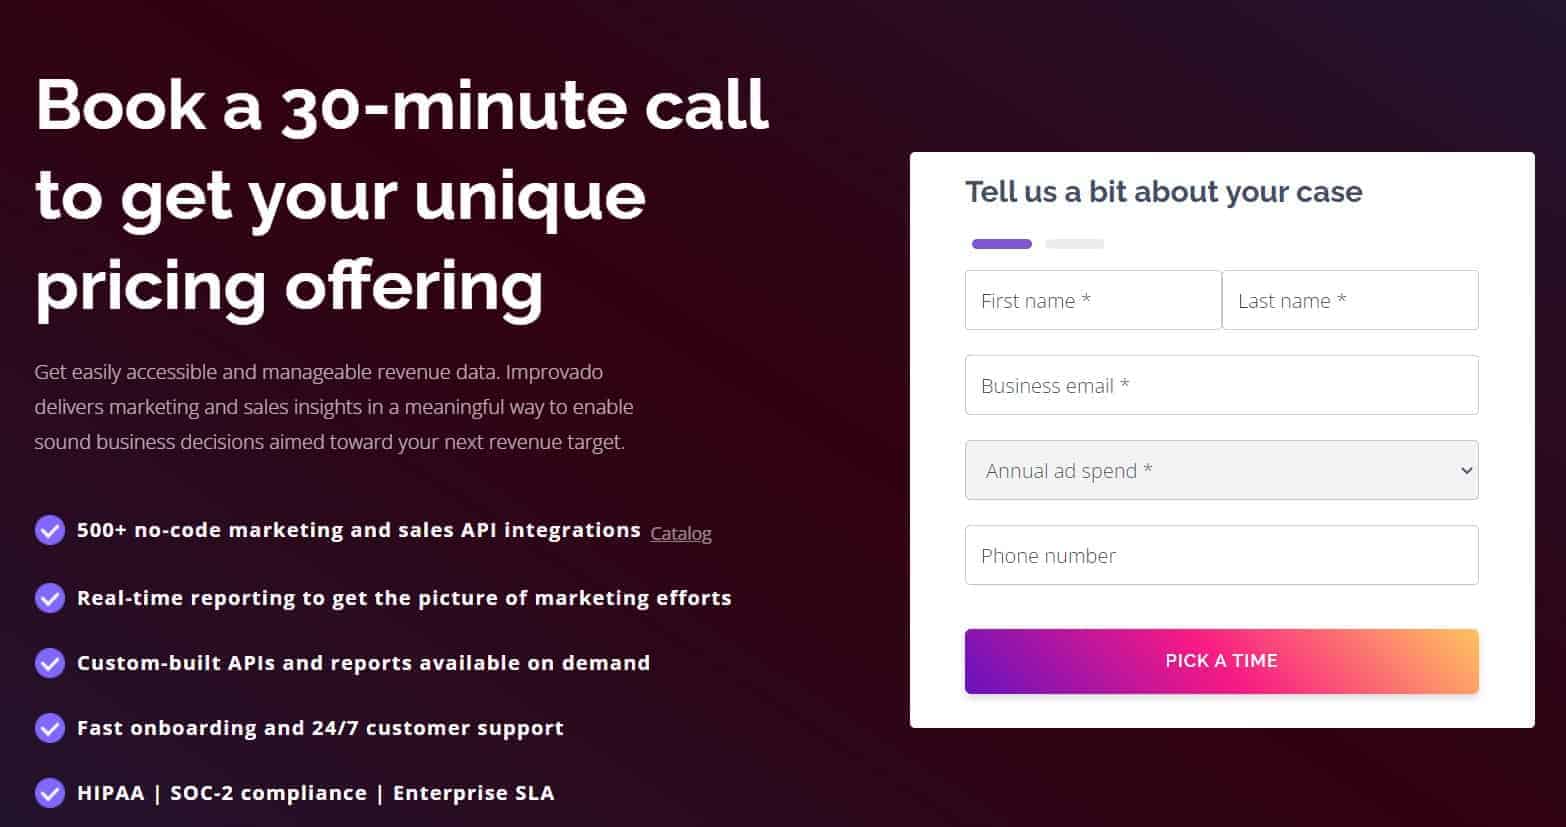
Improvado offers customized pricing based on your specific needs.
You can request a demo and get a quote from their website.
Bottom Line:
Overall, Improvado is a powerful marketing data aggregation and ETL platform that offers a user-friendly interface, customizable dashboards, and automated data integration.
It’s an excellent tool for businesses that want to streamline their marketing data pipeline and make data-driven decisions.
If you are searching for marketing analytics tools that offer more advanced visualization options, you may want to explore some other options.
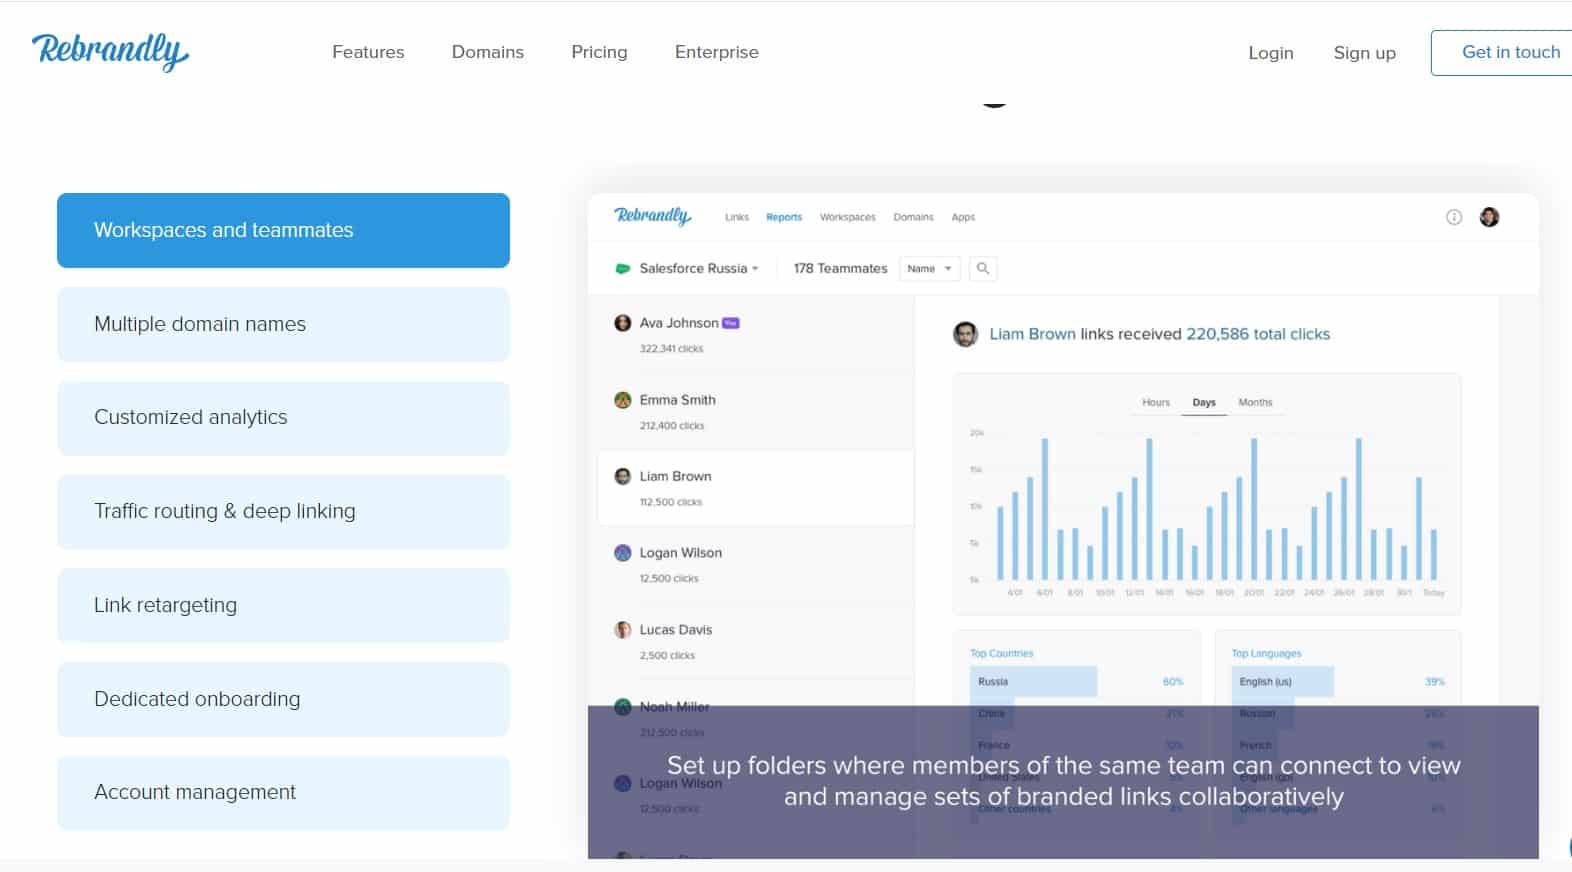
10. Rebrandly
Rebrandly is a link management platform that allows you to create, track, and manage branded short links.
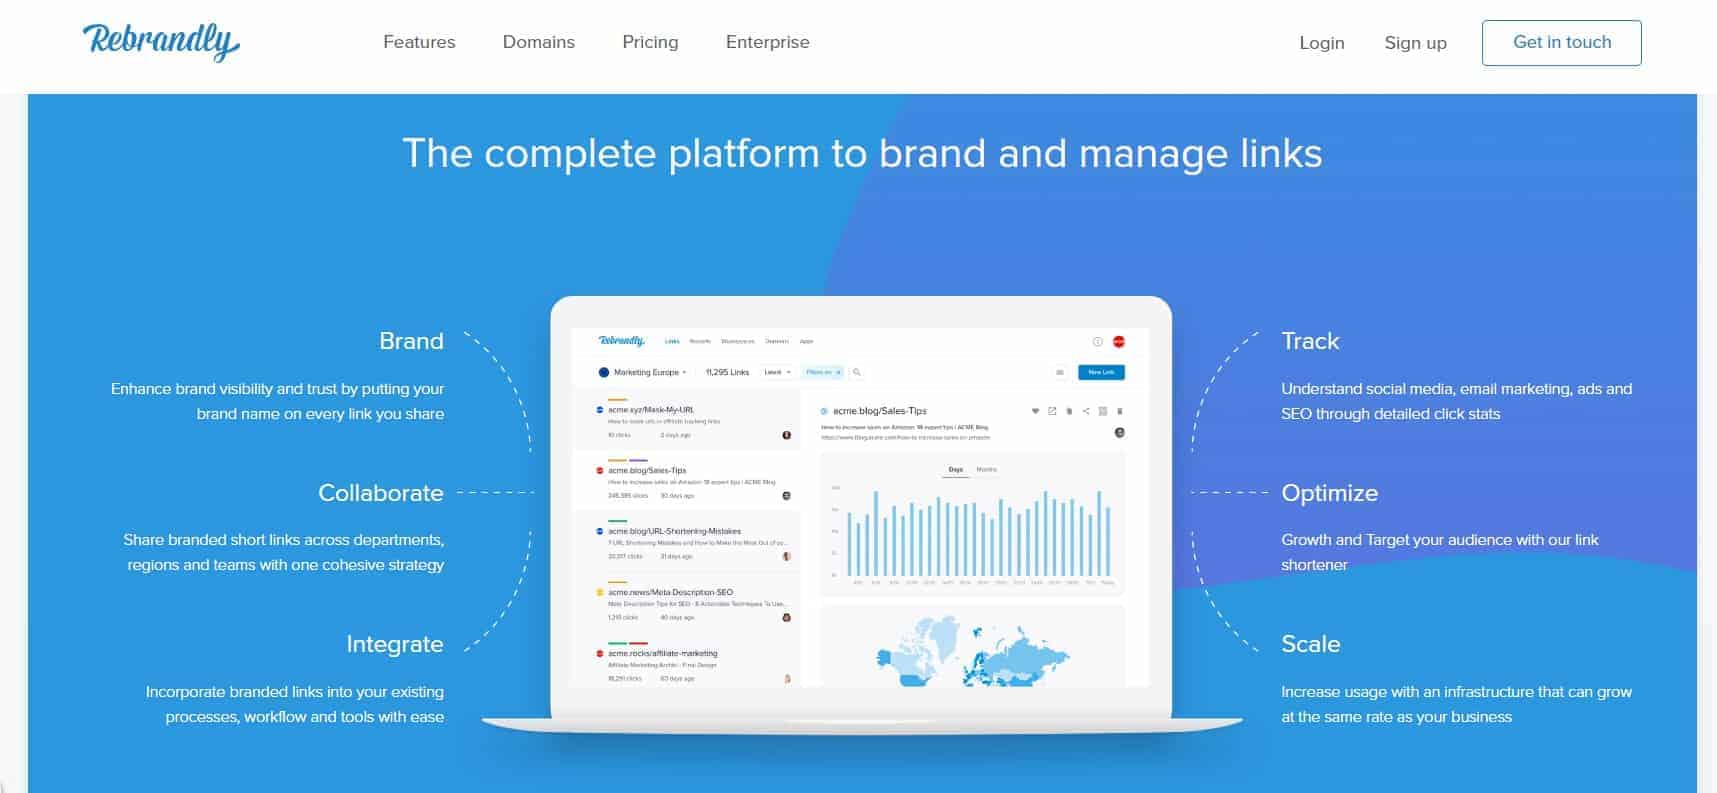
With Rebrandly, you can create custom links that include your brand name, making it easier for your audience to recognize and remember your links.
Key Features:
Custom branded domains: With Rebrandly, you can customize your links with your brand name, making them more memorable and easier to share.
Link tracking: It provides detailed analytics for each link, including clicks, referrers, devices, and geographic locations.
UTM parameters: You can add UTM parameters to your links to track the source, medium, and campaign name for better marketing attribution.
Integration with other tools: Rebrandly seamlessly integrates with various marketing and analytics tools, including Google Analytics, Bitly, Zapier, and more.
What I Like (pros):
Customizable branding: I appreciate the flexibility of creating custom domains and short links that reflect my brand’s identity and help improve recognition.
Ease of use: Rebrandly’s interface is intuitive and user-friendly, making it easy for anyone to start creating branded links and tracking their performance.
Link management: I no longer have to worry about broken or outdated links as Rebrandly helps me monitor and update them regularly.
What I Dislike (cons) :
Limited free plan: While Rebrandly offers a free plan, it has limited features and is not suitable for larger businesses or those with more extensive link management needs.
No mobile app: Although the platform is mobile-responsive, there is no mobile app available, making it less convenient for on-the-go use.
How to Use:
Suppose you want to advertise a new product on your social media accounts.
You can create a branded link with Rebrandly, add UTM parameters to track your campaign’s performance, and share it across your social media platforms.
Then, you can track clicks and other metrics in real-time on the Rebrandly dashboard.
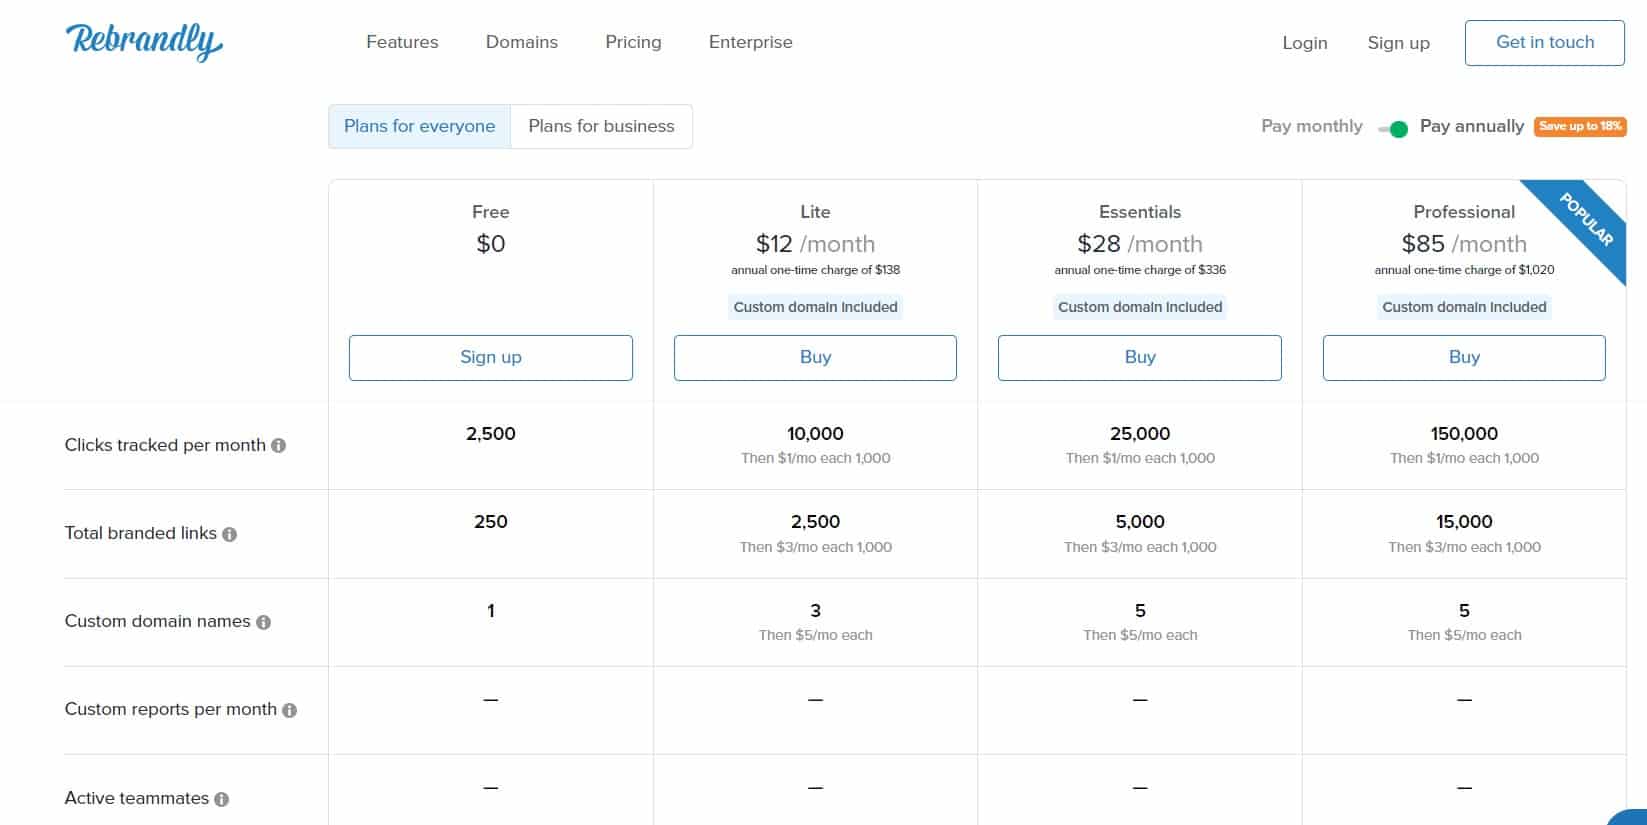
Pricing:
Rebrandly offers various pricing plans, including a free plan with limited features and paid plans starting at $12/month for small businesses and $85/month for larger enterprises.
Bottom Line:
Rebrandly is an excellent link management tool that offers customization, tracking, and integration features.
While its free plan is limited, its paid plans are reasonably priced and offer substantial value for marketers looking to improve their link management and branding efforts.
11. Emplifi.io ( previously SocialBakers) (acquired)
Emplifi.io is a platform for businesses that offers tools to analyze and refine their social media performance for effective marketing.
With features such as content creation, audience insights, and social media listening, Socialbakers helps businesses create effective social media strategies and improve their ROI.
Key Features:
- Content Creator: Emplifi.io provides a content creator tool that allows users to create visually appealing and engaging social media posts.
- Audience Insights: The platform provides deep insights into the audience behavior and preferences to help businesses understand their target audience better.
- Social Media Listening: Emplifi allows businesses to monitor and analyze social media conversations about their brand, industry, or competitors.
What I like (Pros):
- Robust Analytics: Emplifi provides detailed analytics and reporting, making it easy to track the success of your social media campaigns.
- Intuitive Interface: The platform’s interface is designed to be user-friendly, which simplifies navigation and the use of its features.
- Great Customer Support: Emplifi offers excellent customer support through live chat, email, and phone.
What I dislike (Cons) :
Emplifi can be costly, especially for small businesses and startups. Although the platform has an intuitive interface, some of its advanced features may require a bit of a learning curve.
How to Use:
To begin using Emplifi, create an account and link your social media accounts.
Once you’re logged in, you’ll be able to utilize all the features on the platform and begin analyzing your social media metrics.
For instance, the Audience Insights tool can help you comprehend your followers’ characteristics, hobbies, and actions.
You can also use the Content Creator to create visually appealing posts that are optimized for each social media platform.
Pricing:
Emplifi (previously Socialbakers) offers three pricing plans: Essential, Smart, and Scale.
The cost depends on the features you require and the number of social media accounts you wish to link. But please note that the pricing can be high, with the Essential plan starting at $200 per month.
Bottom Line:
Emplifi is a great tool for businesses looking to optimize their social media marketing.
Emplifi offers businesses of all sizes a comprehensive solution with its robust analytics, audience insights, and social media listening features.
However, due to its higher pricing, it may be more practical for larger businesses with bigger budgets.
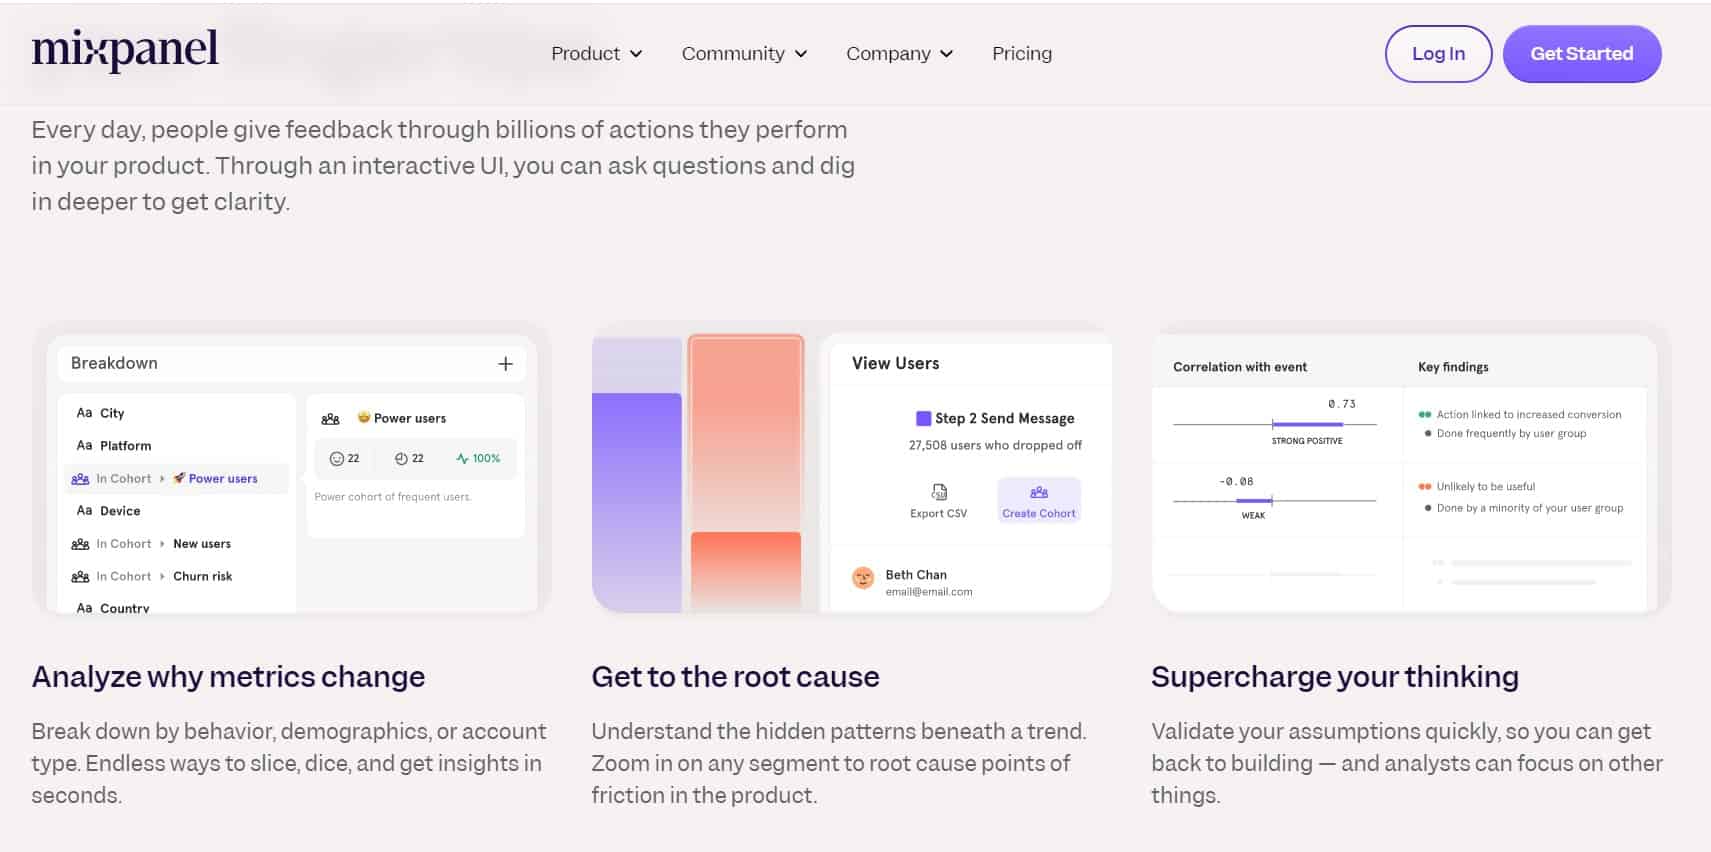
12. Mixpanel
Mixpanel is a product analytics platform that helps businesses analyze user behaviour across web and mobile platforms.
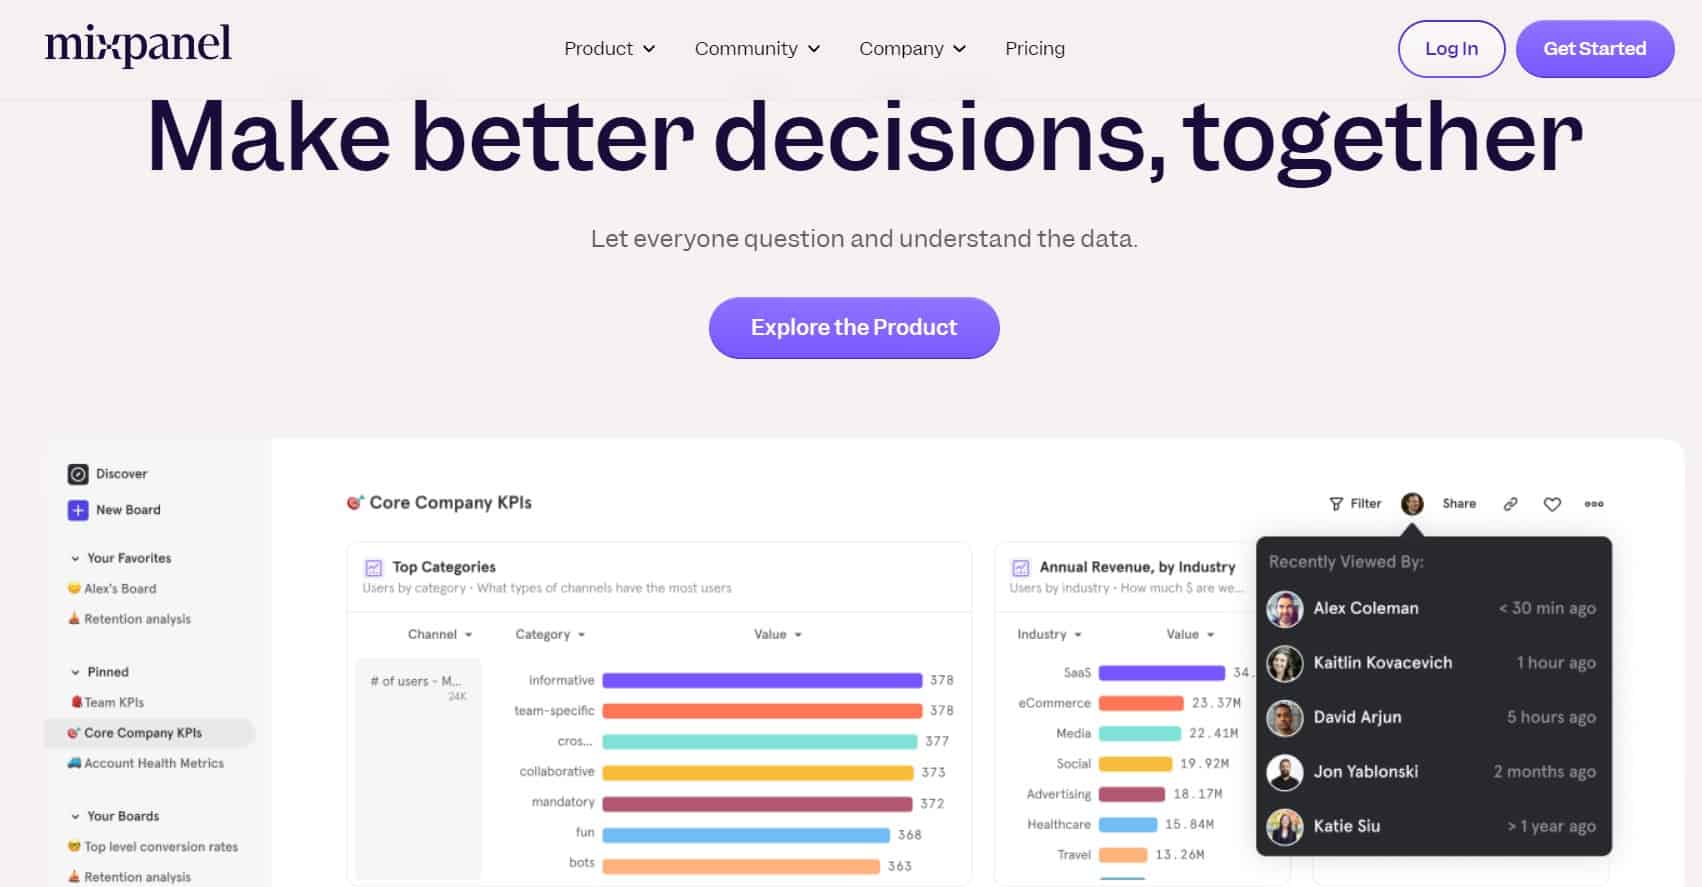
It allows you to track your user journey, from onboarding to conversion and beyond, using custom event tracking and user segmentation.
Key Features:
Custom event tracking: Set up custom events to track specific user actions and behaviours that matter most to your business.
User segmentation: Group your users based on behaviour, demographics, and other custom properties.
Funnels: Visualize and analyze the steps users take to complete a specific action, such as making a purchase or signing up for a subscription.
Retention analysis: Understand how engaged your users are over time and identify factors that contribute to churn.
A/B testing: Run experiments to test and optimize changes to your product, messaging, or user experience.
Why I like (pros):
As a marketer, I like Mixpanel’s capability to offer insights on user behavior and engagement, which is useful in developing new products and marketing strategies.
The custom event tracking and user segmentation features allow me to tailor my analysis to specific business goals and identify key user segments for targeted campaigns.
In addition, I appreciate the interface’s ease of use and the capability to generate customized reports and dashboards effortlessly.
What I dislike (cons)
Mixpanel can be challenging to set up and demands specific technical skills.
This analytics tool’s cost is reasonable when compared to others, but it may still be costly for smaller companies.
How to use :
To get started with Mixpanel, you will first need to set up event tracking and user properties within your web or mobile app.
Once this is done, you can use Mixpanel’s various features to analyze user behaviour, create funnels and retention reports, and run experiments through A/B testing.
For example, you could set up a funnel to track the steps users take to complete a purchase and identify any drop-off points.
Or, you could segment your users based on demographic information and track how engagement levels differ across different groups.
Pricing
Mixpanel offers a free plan with limited features, as well as various paid plans starting at $20+ per month.
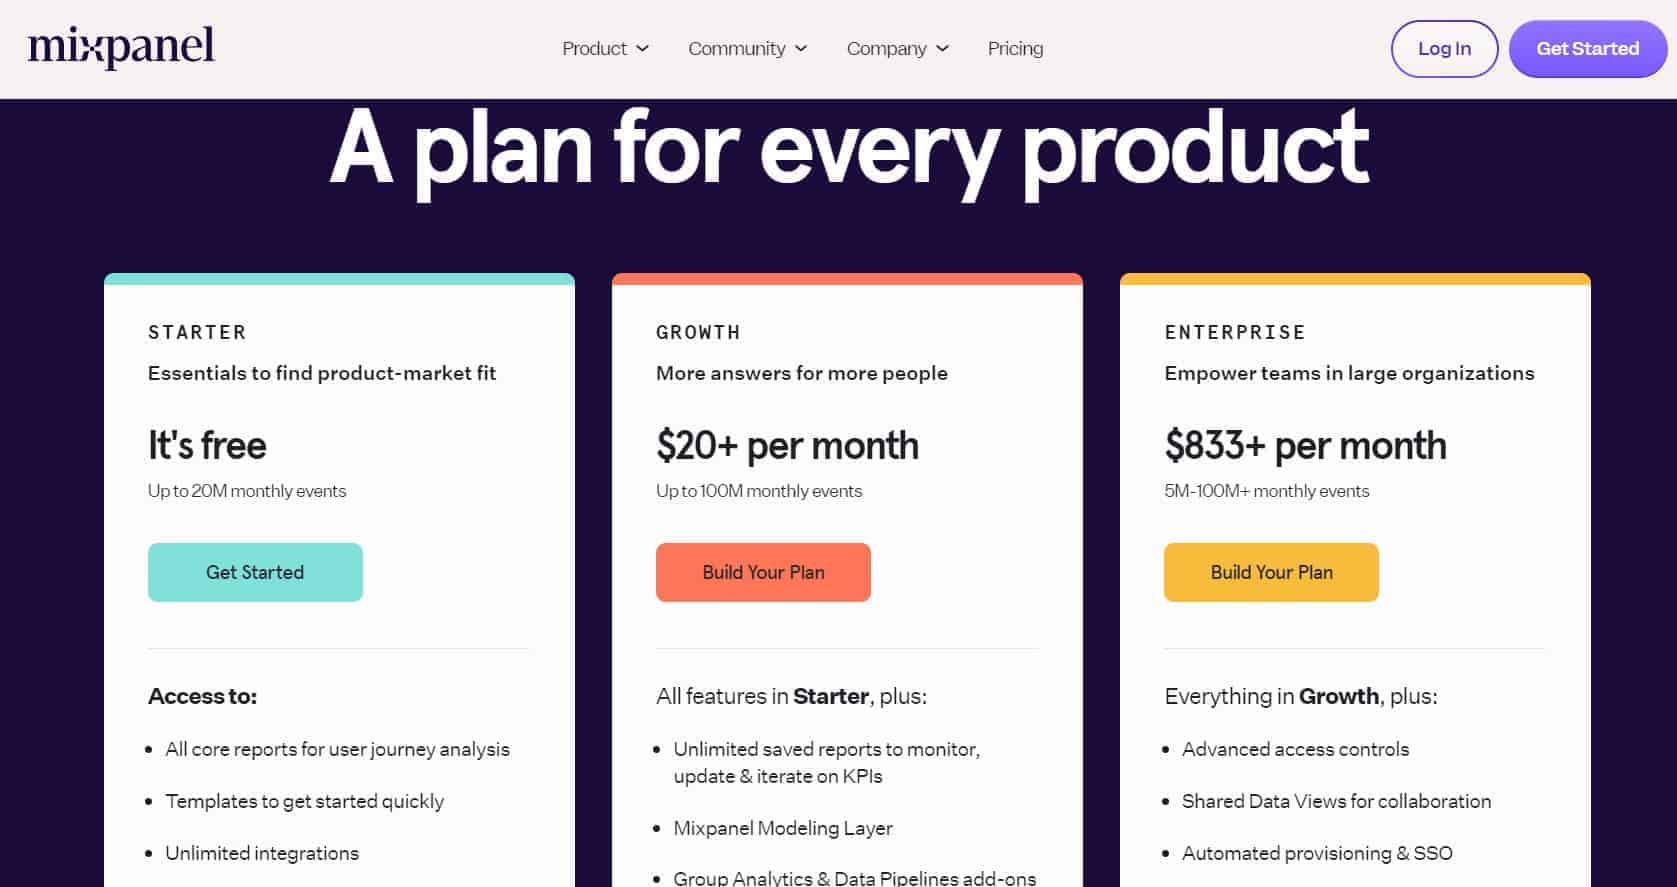
This product may cost more than other analytics tools, but it has customizable event tracking and user segmentation features that can provide valuable insights into user behaviour.
These insights can help businesses optimize their product and marketing strategies.
13. Heap
Heap is a web and mobile analytics platform that helps businesses analyze user behaviour and gain insights into their product usage.
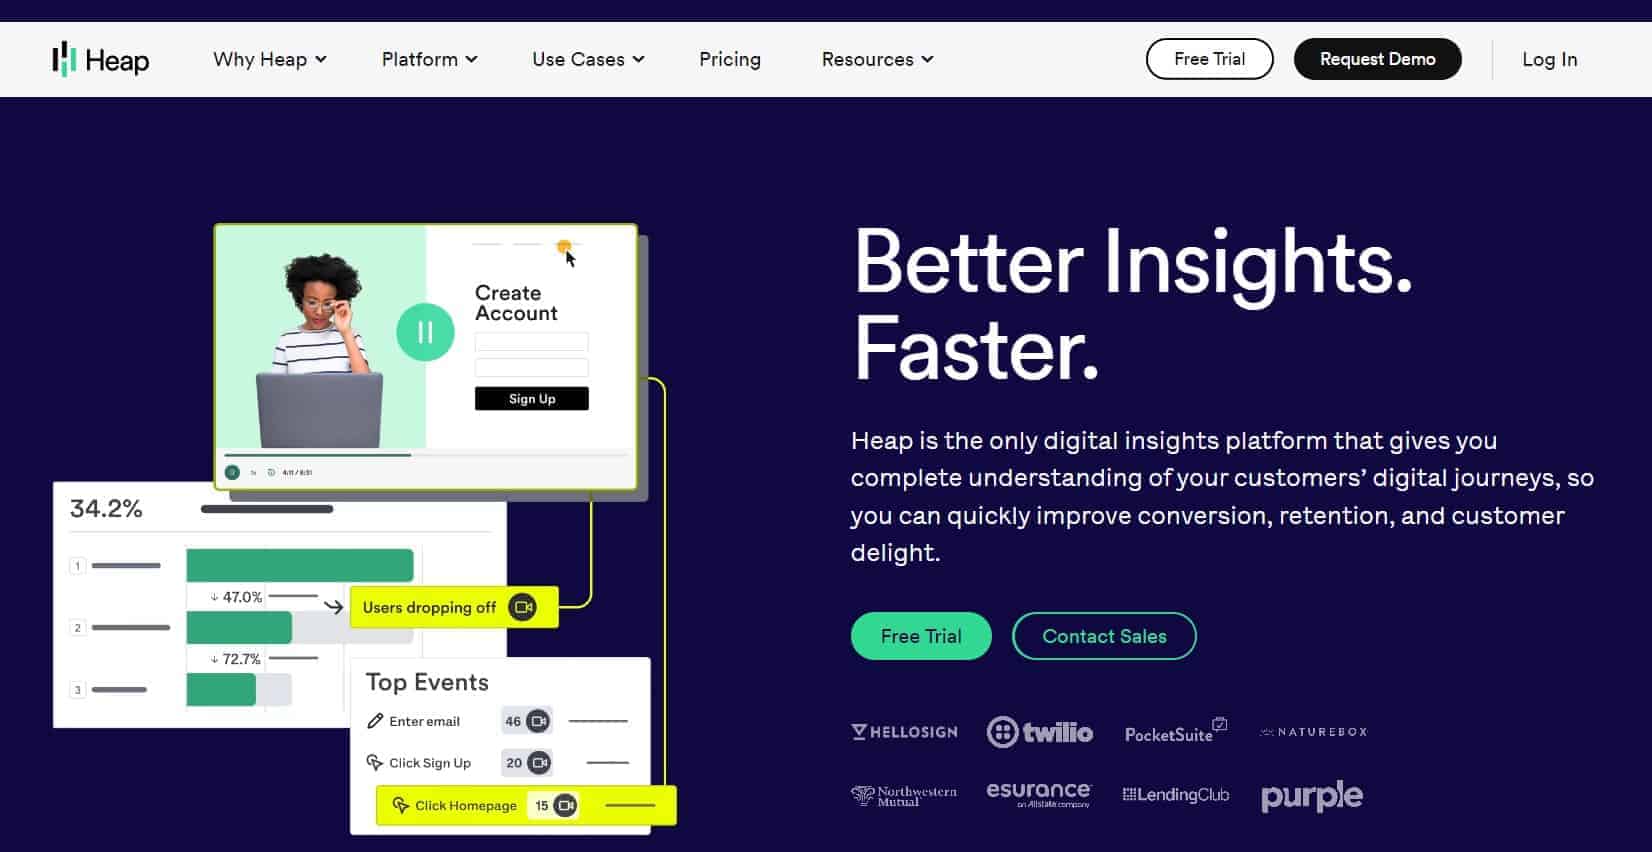
It offers a unique approach to analytics, capturing every interaction and event automatically, without requiring any manual tracking.
This allows businesses to easily track user behavior, analyze data, and make data-driven decisions.
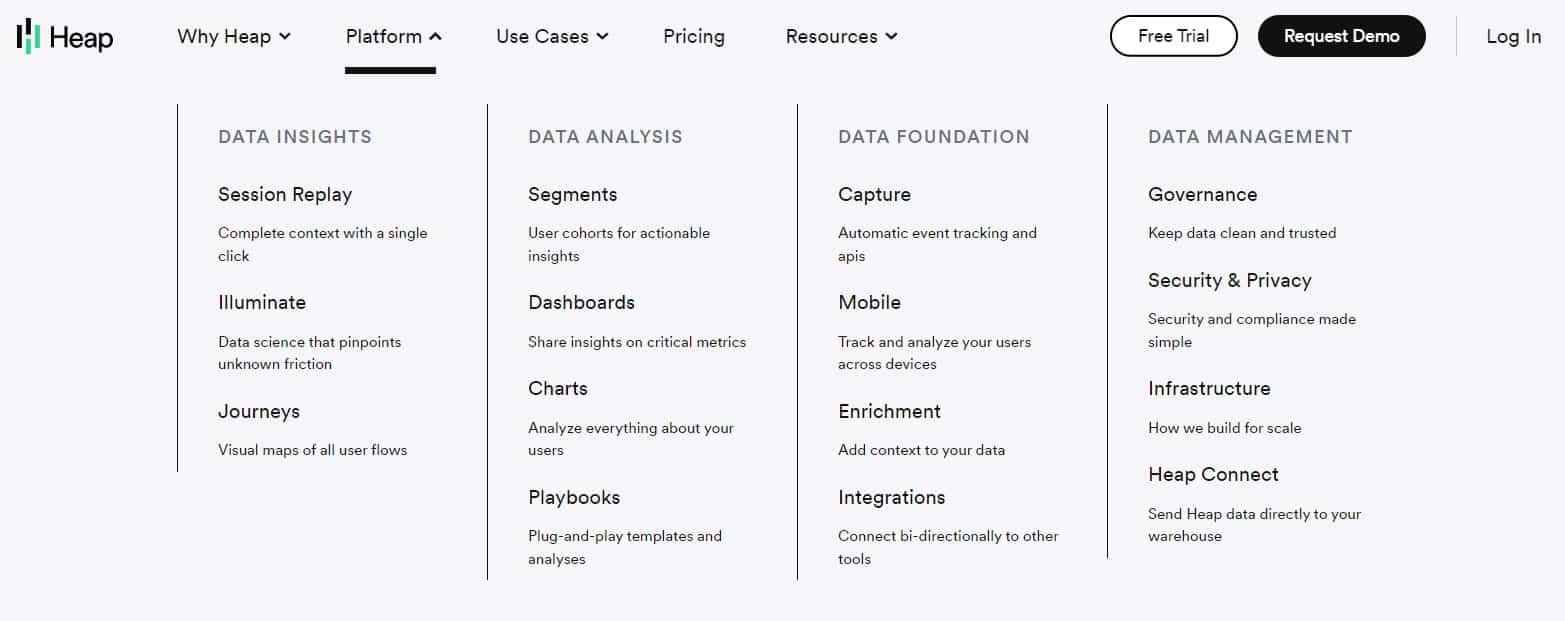
Key Features:
Automatic event tracking: Heap analytics automatically captures all customer interactions on your website or app, so you don’t have to manually define tracking events.
Funnel analysis: You can use Heap to analyse customer journeys and funnels to optimize your user experience and increase conversions.
Behavioural analytics: Heap offers advanced behavioural analytics features that allow you to analyze user behaviour and identify patterns and trends.
Data visualization: Heap provides visualizations of your data to help you understand the behaviour of your users and make data-driven decisions.
What I like (pros):
Automatic event tracking is a huge time-saver and removes the need to manually track events.
Heap’s user interface is intuitive and easy to navigate.
Heap offers a range of powerful data analysis and visualization features that provide valuable insights into user behaviour.
How to use:
You’ll need to install the Heap tracking code on your website or app to use Heap.
Once the code is installed, Heap analytics will automatically begin capturing all user interactions and events.
You can utilize Heap’s data analysis and visualization features to examine user behaviour and make decisions driven by data.
For example, if you want to analyze the actions and behaviours of users on your e-commerce site, including their steps and interactions with your platform.
You can use Heap analytics to create a funnel that tracks the steps users take from the product page to checkout.
By analyzing this funnel, you may discover that users are dropping off at a particular step in the checkout process.
You can then use this insight to optimize the checkout process and increase conversions.
Pricing:
Heap’s pricing is based on the number of monthly tracked users and starts at $499/month for up to 50,000 tracked users.
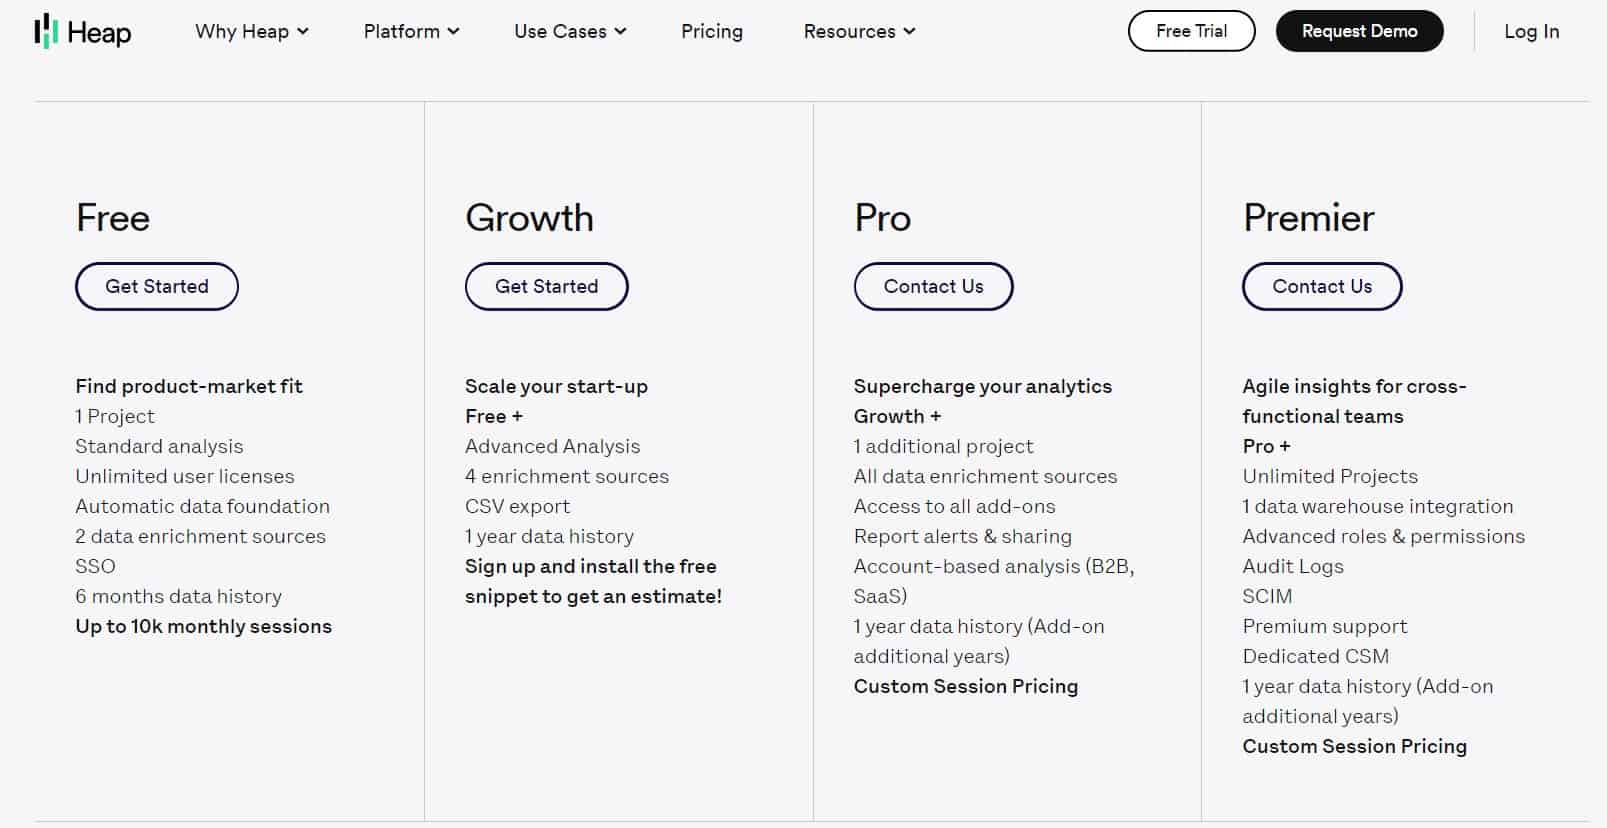
There is also a free plan available, but it has limited features and is only suitable for small businesses with low-traffic websites.
Bottom line:
Heap is an analytics tool that can assist you in comprehending user behaviour and optimizing your website or app with various features.
While it can be expensive for smaller businesses, the automatic event tracking and advanced analytics features make it a worthwhile investment for larger businesses with a need for detailed insights.
What are the 4 categories of analysis in marketing analytics?
1- Web analytics:
Web analytics tools can track and analyze user behaviour on your website, including traffic sources, pageviews, bounce rates, and conversion rates.
Examples of popular web analytics tools are Google Analytics, Adobe Analytics, and Mixpanel.
2-Social media analytics:
If you’re running social media campaigns, it’s important to track your performance and engagement.
Using social media analytics tools can assist you in monitoring your brand’s social media presence, keeping track of engagement metrics, and evaluating the effectiveness of your campaigns.
Some popular social media analytics tools include Hootsuite Insights, Sprout Social, and Socialbakers.
3-Email marketing analytics:
Analytics can assist in refining email marketing for better engagement and conversions, which is a crucial aspect of a lot of marketing campaigns.
Email marketing analytics tools can track metrics such as open rates, click-through rates, and conversion rates.
Some popular email marketing analytics tools include Mailchimp, Constant Contact, and Campaign Monitor.
4-SEO analytics:
To attract visitors to your website without paid advertising, it is necessary to prioritize search engine optimization (SEO).
SEO analytics tools can help you track keyword rankings, analyze your website’s search visibility, and identify opportunities for improvement.
Some popular SEO analytics tools include Moz, Ahrefs, and SEMrush.
To select the most suitable marketing analytics software or tools, you should consider your required features, pricing, and ease of use.
Be open to experimenting with different options until you discover the most effective one for you and your team.
What are analytical tools in digital marketing?
Analytical tools play a crucial role in digital marketing by providing insights and data-driven decisions to help improve marketing strategies.
Digital marketing relies heavily on analytical tools like web analytics, marketing analytics software, and digital marketing analytics.
Web analytics tools are specifically designed to monitor and analyze various website traffic data, visitor behaviour, traffic sources, and conversion rates.
It provides valuable insights into website traffic, audience demographics, and user behaviour.
Other notable web analytics tools include Adobe Analytics, Matomo, and Clicky.
Marketing analytics software assists marketers in measuring and analyzing how well their marketing efforts are performing across different channels such as email, social media, and advertising.
With this information, marketers can obtain a complete perspective of their campaigns, pinpoint areas requiring enhancement, and improve their overall strategies.
Some of the best marketing analytics software include HubSpot, Marketo, Salesforce Marketing Cloud, and Google Marketing Platform.
Digital marketing analytics tools provide various analytical features to assist marketers in monitoring and evaluating their digital marketing endeavours.
These features include tracking website traffic, social media interactions, email campaigns, and online advertisements.
Some of the most popular digital marketing analytics tools and advanced keyword search operators include SEMrush, Ahrefs, Moz, and SpyFu.
In conclusion, web analytics tools, marketing analytics software, and digital marketing analytics tools are essential for digital marketers to analyze and measure the success of their marketing efforts.
To improve their marketing performance, marketers can benefit from utilizing effective marketing analytics software and tools which enable them to make data-driven decisions and optimize their marketing strategies.
What is an example of marketing analytics?
One example of marketing analytics platforms could be tracking the performance of email marketing campaigns.
By using marketing tools, teams can gather marketing data on the open rates, click-through rates, conversion rates, and other metrics for their email campaigns.
Marketing data management is used to inform marketing strategy and optimize future campaigns for better performance.
Example:
Suppose you’re a marketing manager for an e-commerce store selling clothing items.
You want to know the marketing channels that bring in the most revenue and how customer behaviour varies across those channels.
To achieve this, you can utilize a marketing analytics platform such as Google Analytics or Mixpanel to monitor data from your website and other marketing channels.
These tools allow you to create personalized tracking for each marketing campaign and see data on things like traffic, conversions, and revenue earned from each campaign.
Additionally, you can examine user activity on your website, such as which pages they visit, how long they stay, and where they leave the conversion process.
You can gain valuable insights into your marketing strategy and increase your revenue by analyzing this data.
An example could be that you have found out that your email marketing campaigns are resulting in more conversions compared to your social media advertisements.
With this knowledge, you can allocate more resources to your email campaigns and adjust your overall marketing strategy to align better with customer behaviour.
How is data analytics used in digital marketing?
Data analytics is crucial for digital marketing as it allows teams to understand their audience and make more informed decisions.
We gather and analyze customer data from various sources, including web and marketing analytics tools.
Analyzing data can help us understand our audience’s behaviour, preferences, and needs.
In the context of digital marketing, we often employ web analytics tools like Google Analytics to monitor and study website traffic.
We can use this tool to monitor the activities of website visitors, such as the pages they access and the duration of their stay on each page.
We can use this tool to track the number of visitors coming from various sources like social media or email campaigns.
This can help us analyze the effectiveness of our marketing campaigns.
Another way we use data analytics is to measure the performance of our marketing campaigns using marketing analytics software.
We can use this software to keep track of important metrics like click-through rates, conversion rates, and customer acquisition costs.
We can pinpoint which aspects need improvement by examining these metrics and tweaking our marketing tactics accordingly.
Data analytics is crucial for marketing teams to enhance their marketing strategies and achieve higher ROI (Return on Investment).
The top marketing analytics tools help us to make data-driven decisions and continuously improve our marketing strategies to serve our audience better.
Conclusion / Final Thoughts
To summarize my experience with different marketing analytics tools and software,
I strongly believe that it’s essential for any marketing team to invest in top-quality marketing analytics tools.
Using appropriate tools makes it possible to keep track data, acquire valuable insights and enhance the performance of marketing campaigns, thereby improving the overall ROI.
Numerous options cater to your specific needs, whether web analytics tools, marketing analytics software, or marketing data management platforms.
Exploring the top marketing analytics tools and software available in the market can give you a competitive edge and keep you ahead in the ever-changing digital landscape.
I suggest utilising these tools if you’re committed to achieving your marketing goals.
Your marketing team will hands down appreciate it.